
HMI Report
Introduction
The HMI report can be presented in the browser as a set of HTML documents. The documents that make up the report are interlinked and can be navigated using the navigation bar. Other output formats are CSV and Excel. The information provided by this report can allow you to answer several questions regarding your solution. These can include, but are not limited to:
- How many bitmaps are loaded in my solution?
- How many of these bitmaps are actually being used within my solution?
- What is the biggest/smallest bitmap within my solution?
- What controls/widgets/behaviors/texts are contained in my solution, and where are they used?
The HMI report will be presented in the browser as a set of HTML documents. The documents that comprise this report are interlinked and can be navigated by using the navigation bar.
Generating the Report
Upon opening Scene Composer and loading your solution, click Report within the main toolbar. Select the HMI Report... option to display the HMI Report dialog box, in which you can customize several aspects of your report.
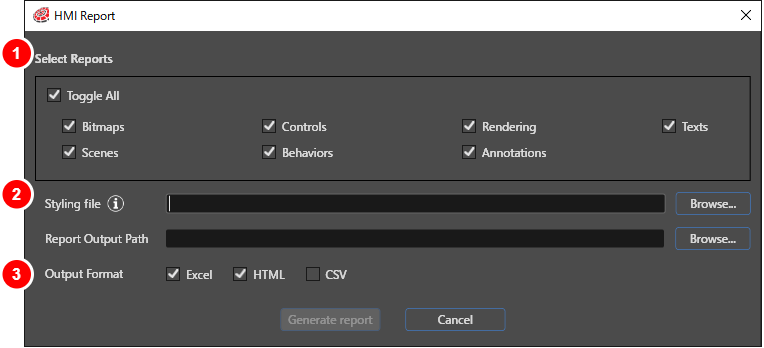
| 1 |
Customize the sub-reports included in the generated HMI report. Check the checkboxes for the items to be output. For details on each item, see Report Content. |
|
| 2 |
Styling file |
This will specify where to retrieve the custom .css file to apply to HTML the documents. If left blank, a default styling file will be used. |
| Report Output Path | This is where you specify the output location for the documents. | |
| 3 |
This option specifies the format of the output report. See Output Formats for more information. |
|
After selecting the report’s output path, style file, and contents, press the Generate report button to proceed with generating your report.
Report Content
Report Sites
Report Options fill generate the following report pages:
- Bitmaps
- Bitmaps(summary): An overview of all the bitmaps within your solution. Contains data on bitmap averages, largest and smallest bitmaps, referenced pixel formats, and the frequency at which said formats are referenced.
- Bitmaps Details(detailed): Contains a paginated display and search bar for visualizing available parameter information for all bitmaps. Entries can be sorted by column.
- Used Bitmaps(summary): An overview of the referenced bitmaps within your solution. Contains data on bitmap averages, largest and smallest bitmaps, referenced pixel formats, and the frequency at which said formats are referenced.
- Used Bitmaps Details (detailed): Contains a paginated display and search bar for visualizing available parameter information for all bitmaps. Entries can be sorted by column.
- Unused Bitmaps(summary): An overview of the unreferenced bitmaps within your solution. Contains data on bitmap averages, largest and smallest bitmaps, referenced pixel formats, and the frequency at which said formats are referenced.
- Unused Bitmaps Details(detailed): Contains a paginated display and search bar for visualizing available information for all bitmaps. Entries can be sorted by column.
- Bitmaps(summary): An overview of all the bitmaps within your solution. Contains data on bitmap averages, largest and smallest bitmaps, referenced pixel formats, and the frequency at which said formats are referenced.
- Texts
- FontsandStyles: Contains outline of how often particular Fonts and Style are used.
- Translations: Contains outline of how often particular translations are used.
- FontsandStyles: Contains outline of how often particular Fonts and Style are used.
- Controls
- Controls: A list with the 30 most used controls (if available) and how many times each control was used in all scenes.
-
- Also includes a list of all controls and how many times each control was used within all available scenes.
- Also includes a list of all controls and how many times each control was used within all available scenes.
-
- Controls: A list with the 30 most used controls (if available) and how many times each control was used in all scenes.
- Behaviours
- Behaviors: A list of all behaviors and the scenes in which they are used. Also includes the scene type, behavior name, and the name of the entity associated with the behavior and a list of all behaviors indexed first by name, then by the scene in which they are used.
- Widgets: A list of the 30 most popular widgets (if available) and the frequency each widget was used in all scenes.
Also includes a list of all widgets, indexed by widget name and each scene in which said widget was used.
- Behaviors: A list of all behaviors and the scenes in which they are used. Also includes the scene type, behavior name, and the name of the entity associated with the behavior and a list of all behaviors indexed first by name, then by the scene in which they are used.
- Scenes
- 2D Scenes: A list of all 2D scenes within the solution. A table will be created for each scene showing the quantity of each of the following elements:
-
- Bitmaps
- Controls
- Render Nodes
- Text Nodes
- Widgets
- Bitmaps
-
- 2D Scenes Details (details): A list of all 2D scenes in the solution. A table will be created for each scene containing the names of the following elements:
-
- Bitmaps
- Controls
- Render Nodes
- Text Nodes
- Widgets
- Bitmaps
-
- 3D Scenes: A list of all 3D scenes within the solution including the number of vertices and triangle of each 3D scene.
- 2D Scenes: A list of all 2D scenes within the solution. A table will be created for each scene showing the quantity of each of the following elements:
- Annotations
- Annotations: A list of all annotations in the scene, for any node whose annotations property is set.
- Annotations: A list of all annotations in the scene, for any node whose annotations property is set.
- Rendering
- Rendering: A list of all effects that are used, and how often each effect was used within the solution and a similar list is also provided for text caching strategies and a list showing which text caching strategies are associated with each node, as well as the name of the scene in which said nodes can be found.
- Blending: A list of each blending combination effect and how often they have been used and a list of the blending combinations indexed by combination type, scene type (2/3D), scene name, and then by the entity name associated with the blending combination.
- Rendering: A list of all effects that are used, and how often each effect was used within the solution and a similar list is also provided for text caching strategies and a list showing which text caching strategies are associated with each node, as well as the name of the scene in which said nodes can be found.
Output Formats
- Excel: Basic Excel tables will be generated under selected path under in reports_excel. The particular sites will be accessible as excel pages.
- HTML: Html pages with navigation and basic sorting and filtering will be generated under the selected path in reports_html. The particular sites can be accessed through the navbar.
- CSV: CSV files will be generated under the selected path under in "csv". The respective pages will be accessible as csv files.
File Structure
HMI Reporting binaries are located within the Reporting folder of the bin directory (bin/Reporting).
- images - The various icons required to generate the html report.
- js - Utility scripts and other dependencies (i.e. jquery).
- styles - The available CSS files.
- logs – Contains logs that describe potential errors.
- doc - Contains a developers guide for the Python pipeline.
- scripts - Contains the Python scripts responsible for generating each subreport.
- apy.py - Contains several helper functions for computation purposes.
- driver.py - Contains the driver logic that generates the report.
- setup.bat - Script that install the necessary Python modules (dependencies).
Standard HTML Assets
HMI Reporting assets for HTML pages like css, icons, and js are available under /bin/ HMIReportAssets.
Using the Command Line for Report Generation
CssFilePath is an alternative absolute css file path.
ReportList is a list of sub-reports that should be generated separated by #.