Usage and Dependencies
Find Usage & Dependencies
Use this feature by opening a SceneComposer solution to activate and select the Graph Dependencies panel.
- Activate the panel by selecting "View" > "Editors" > "Graph Dependencies".
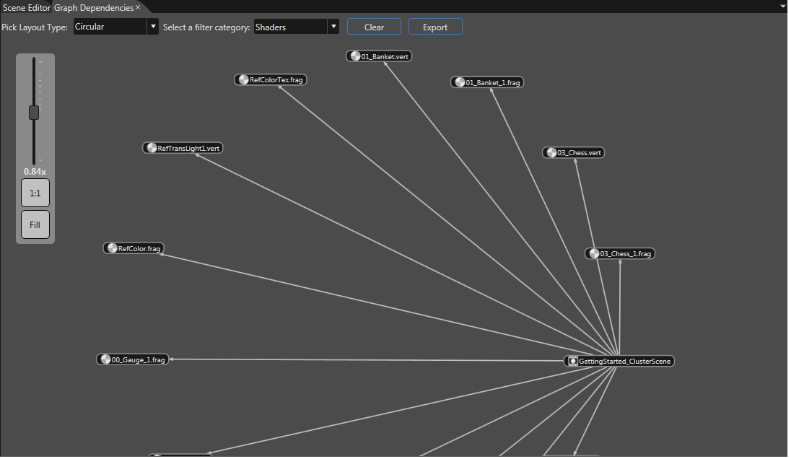
- The graph panel represents in a visual form the nodes and the connections that unify them.
The edges that link the nodes show the dependencies that exist among the items. The layout graph panel can be docked in SceneComposer.
-
By using the "Export" button the user is allowed to export the "Dependency Graph" as an .xml file with nodes based on items types and names.
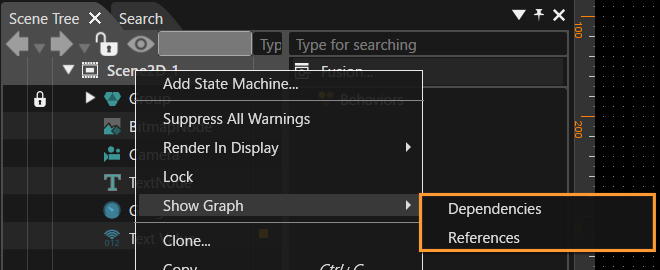
After the Graph Dependencies panel is selected, right-click on the scene and select "Dependencies" or "References" from the context menu (see below).
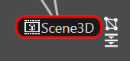
If the "Dependencies" option is selected, the graph will become visible inside the Graph Dependencies panel. If the "References" option is selected, the current selected scene will become visible inside the Graph Dependencies panel. When the current selected scene is pressed, two option are displayed as two buttons near the selected scene icon: "Show the dependencies of this node" and "Show the references where this object is used".
On the left side of the panel there is a cursor, which allows to establish the dimensions of the graph. There are several different possibilities to set the dimensions of the graph:
- By using the 1:1 button (the graph will have an optimal dimension)
- By using the "Fill" button (the graph will fill the whole panel)
- By using the cursor (the dimensions should be set in a range between 0 and 100.00)
- By using the combo Ctrl + Mouse Wheel
At the same time, there are some combinations that can be seen in the next figure:
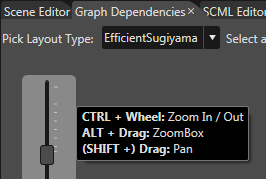
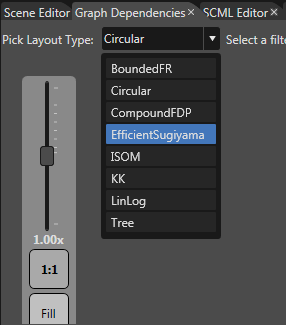
On the top side of the Graph Dependencies panel there are some other possible options. First, it is possible to select the desired layout type of the graph by using the "Pick Layout Type" list. There are several different algorithms to display the graph:
- Bounded FR
- Circular
- Compound FDP
- Efficient Sugiyama
- ISOM
- KK
- Lin Long
- Tree
The most common one from all these graph types is the Efficient Sugiyama.
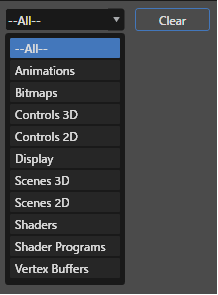
- Animations
- Bitmaps
- Controls 3D
- Controls 2D
- Display
- Scene 3D
- Scene 2D
- Shaders
- Shader Programs
- Vertex Buffers
By left-clicking on a node in the graph two buttons will appear in the right corner:
- "Show references" which will display the usage of an item in a graph with navigation and scene tree synchronization
- "Show all dependencies" which will display all the dependencies of an item in a graph
Another given possibility is to move the graph in the Graph Dependencies panel. For example, if the "Scene" category is selected, you will be able to see the relationships between the main scene and all the scenes associated with those imported .fbx that are used in the main scene.
It is possible to select and to move the whole graph; to do this, just left click somewhere near the graph and hold down the left button of the mouse. On this way, it is possible to move the entire graph in any desired place inside the panel. If just one of the scenes is selected by clicking on it, it will be possible to move just that element.
-
When a category with many elements is filtered by using the specific menu list, the graph will not be centered and the only visible elements can be some peripheral parts of the tree.
To center the graph, first, the "Fill" button has to be used. After this, the "1:1" button will center the graph instantly. Last but not least, even though the filter category is used to show a specific category, it is possible to choose one or many elements that do not pertain to that category to be shown. To obtain this effect let's suppose that the Scene category was previously selected. By right-clicking on any scene displayed in the graph, there is a "Pinned" option available in the context menu.
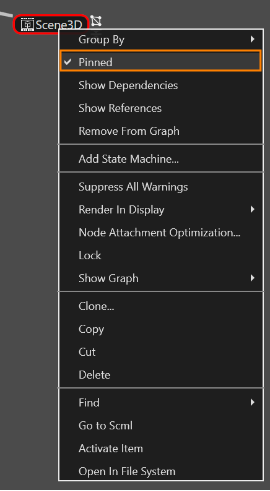
In the case of the main scene, these "Pinned" option is enabled. For any other secondary scene this option is disabled. If this option is enabled, the graph will display all the elements of that category, plus the "pinned" elements from the previous category.
Activation of Items Referenced
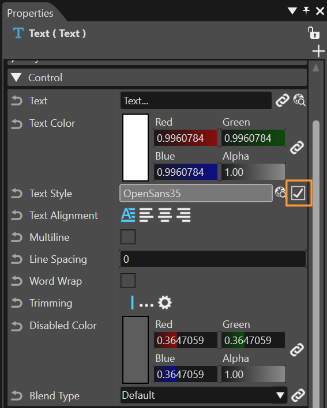
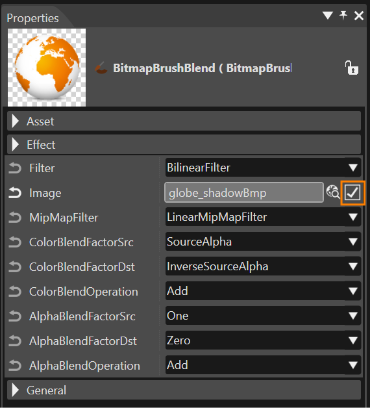
If necessary, it is possible to activate items referenced through paths. The Activate button will load the item in the property grid and in others panels linked to the type of the item.
This feature is available for any referenced item as can be seen in the examples below.
For a TextStyle referenced by a text node:
For a Bitmap referenced by a bitmap node:
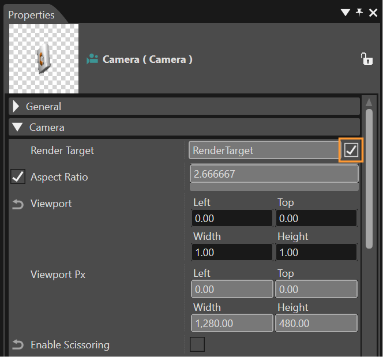
For a Render target referenced by a camera: