Measurement Concepts
Introduction
Measurement Concepts
The Analyzer measurement module allows the user to analyze measurements performed and recorded on the host simulation or target.
It is important to differentiate between the concept of a recorder and the concept of a recording. A recorder is a means to record something, as a DVD recorder is a means to record a DVD.
Recorders
The concept of recorders lies at the heart of the Analyzer performance log recording and analysis.
Examples are recorders to record
- Every point in time, a new frame starts (an Event Recorder)
- How long it takes an OpenGL call (e.g. glDrawArray) to return to the caller (a Timing Recorder)
- The current CPU or GPU load (a Value Recorder)
In order to cover these three main areas of interest (events, durations, values), the following six recorder classes were defined:
Every recorder has the following properties:
- Name: A name unique in the recorders class
- Class: The class to which he belongs
Recorder Classes
Event Recorder
Event Recorders are the simplest recorders. They just record an event at a given point in time.
Timing Recorder
Timing Recorders are used to measure durations. Therefore, begin- and end time of a timing recording may differ.
Asynchronous Timing Recorder
An Asynchronous Timing Recorder is a timing recorder that starts recording in one execution block and may end in a different one.
Cumulative Timing Recorder
A Cumulative Timing Recorder does not keep track of every single timing it was used to record. Instead, it sums up all durations recorded and also keeps track of the number of recordings.
Value Recorder
A Value Recorder is used to record a value at a point in time. These values may be signed or unsigned long values.
Values may have the following relationship:
Example for value relationships:
An application records memory consumption and uses a recorder for this task. The application allocates first 1000kb and then 500kb. At the end, the total (absolute) consumption is 1500kb.
- When using a differential Value Recorder, the application would first record the value 1000 and then the value 500.
- When using an absolute Value Recorder, the application would have to first record 1000 and then 1500 to achieve the same effect.
Cumulative Value Recorder
A Cumulative Value Recorder, similar to a Cumulative Timing Recorder, does not keep track of every value it was used to record, but sums up all values and counts the times something was recorded.
Recordings
A recording represents actual data recorded, e.g. one new frame event recorded at 1000 ms after system startup. Depending on the recorder used, the following is recorded:
- A signed or unsigned long value
- An Event
- A Duration
Separation/Interpretation of Data
Separation of Data and Interpretation Information
In order to gain flexibility, performance log data and the information about how they have to be interpreted and displayed are separated. This separation is reflected on the file system level: performance log data is stored in .perflog files and the meta-information for interpretation is stored in an XML file (PerfDataConfig.xml). The meta-information comprises the following:
- The name to use for display
- The foreground color to use for display
- The background color to use for display
- For value recorders:
> If the values have to interpreted as signed or unsigned
> The relationship of the values (Absolute, Differential, Unrelated) - For cumulative value recorders:
> If the values have to interpreted as signed or unsigned
The meta-information can be edited using the View Configuration Dialog (see Section View Configuration Dialog).
Views - Filtering - Sampling
Views
A view shows certain aspects of the overall recorded information and thus helps the user to focus on the information he needs to see.
See also:
Filtering
Each view except Dashboard View and Treemap View allow filtering to display the desired recordings only. Every filtering-enabled view supports filtering by a means of its own and filtering will be described in the corresponding sections. Filtering is always done before sampling.
Sampling
Sampling is, similar to filtering, a means to reduce the amount of data displayed. A filtering expression can be arbitrary, whereas a sample always contains all (not-filtered) recordings between two given points in time.
What is or is not contained in a sample is defined by the sampling strategy in use. There are currently two sampling strategies available:
- Event Sampling Strategy
- Duration Sampling Strategy
If an event sampling strategy is used, all recordings between two events of the same type belong to the same sample (e.g. all recordings between two occurrences of the "New Frame" event). The duration sampling strategy combines all recordings that are e.g. in the first 1000 ms after recording started into one sample.
See also:
File Filter
File Filter Overview
A performance log can contain a huge amount of recordings. More recordings lead to a more detailed information about the own system.
However loading millions of recordings into the Analyzer also leads to a dull application with a barely comprehensible dataset.
A good way to reduce the amount of data is to filter recordings away which are not useful in the current analysis.
This step is done during the loading process of a file and is an optional feature.
In general the loading speed will not be reduced due to the additional filtering effort but the Analyzer will work more smoothly and the data will be concreted to the requested analysis.
Open Filtered File
GUI Overview
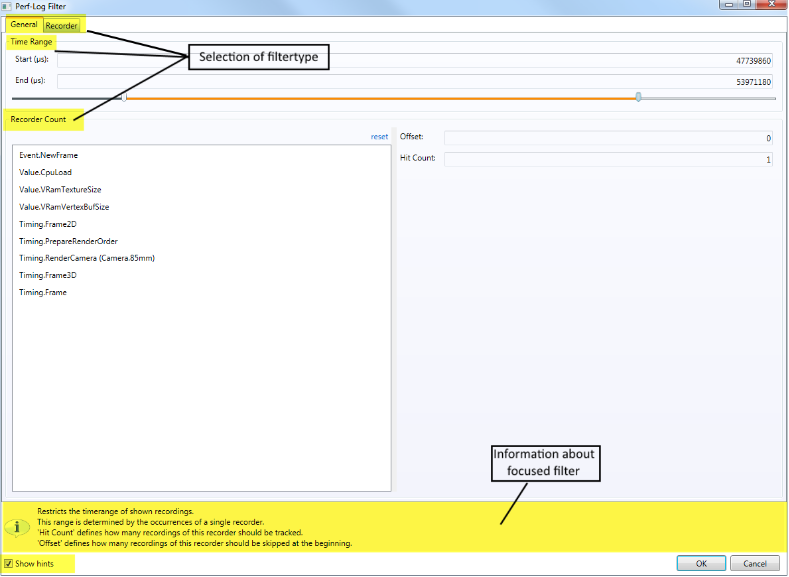
The GUI has two tabs which both contain filter. The first tab (General) contains timespan changing filter.
The second tab (Recorder) contains a filter to show or hide recordings.
At the bottom of the window is a information area. It shows a brief overview how a filter is meant to be used.
This information area can be toggled off, so it will not show any more.
Time Range Filter
The time range filter is the most basic filter. You select the exact time range which will be loaded. There is a start and an end time. Everything before the start and after the end time will be truncated during loading. This filter applies to all other filter.
Other filter will operate on the remaining subset of recordings.
Recorder Count Filter
The recorder count is a filter which indirectly influences the time range. The concept of this filter is to only show data starting from a specific recording and ending after this recorder type appeared a defined amount of times.
The filter is split a recorder list and two options.
Within the recorder list a recorder can be selected. This recorder is used for the occurrence count. The recorders are listed as annotated recorders. So the selection is limited to a recorder subtype.
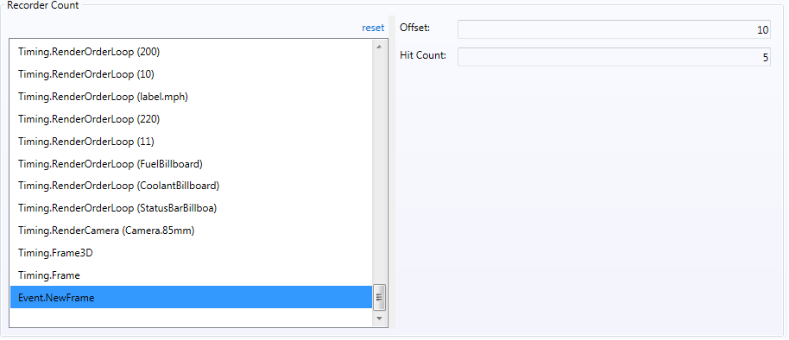
The option Offset defines the amount of skipped recordings of the selected recorder at the beginning.
The option Hit Count defines how often the recorder occurs. Afterwards the loading of file stops.
When the hit count is reached this last recording will still be loaded.
Typical use case:
Select Event: New Frame
Offset: 10
Hit Count: 5
Result: Skips the first 10 frames; shows 4 frames and the occurrence of the 5th new frame event.
Recorder Count Filter
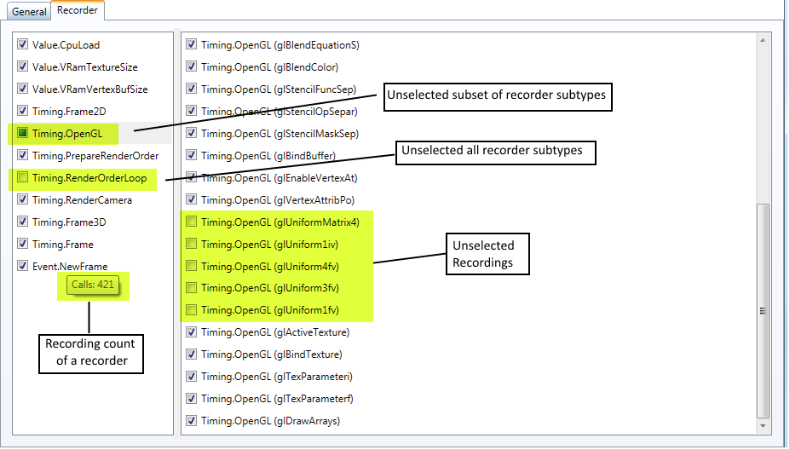
The recorder selection filter is used to hide specific recorder (sub-)types.
A type is based on recorder type and recorder ID. The subtype of such a recorder takes the annotations into account. The different subtypes or a whole type can be (un-)selected. An unselected recorder will not be loaded. Its nested recordings will be moved to the recording above.
Brief example:
A duration recording (A) contains two occurrences of another duration recording (B).
Recording B contains additional recordings (C). Unselecting the recorder of recording B will hide all occurrences of B.
The additional recordings C will be moved to A as its parent.