
Usage
Main Toolbar
After the connection to the application has been established, the main Frame Debugger toolbar will become active.
-
The available features here depend on the enabled features in the application during build time and on the platform on which the application is running.

- Application
- Control application execution.
- Pause: Pause application
- Continue: Continue application execution
- Single Step: Continue application for one frame
- Frame Overview Capture
- Starts recording of all events of the next rendered frame in the application. The checkboxes indicate which events will be captured.
- Capture 2D/3D: Indicates whether 2D/3D rendering events will be captured.
- Cameras: Track which cameras are rendered.
- Nodes: Track which nodes are rendered.
- OpenGL: Track all OpenGL calls issued during the frame.
- Capture Node
- This button is enabled after a frame overview capture has been completed and a valid node is selected in the resulting frame timeline. The checkboxes indicate which buffers will be captured.
- The Node Capture will capture the state of the render target before and after the selected node has been rendered.
- Capture Camera
- This button is enabled after a frame overview capture has been completed and a valid camera is selected in the resulting frame timeline. The checkboxes indicate which buffers will be captured.
- The Camera Capture feature will capture the state of the render target before and after the selected camera has been rendered.
Frame Overview Capture
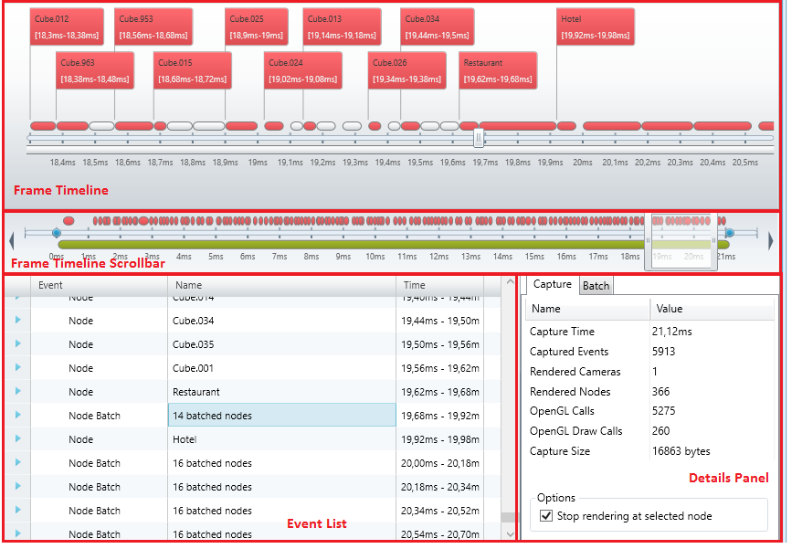
The frame timeline displays the cameras and nodes rendered during one frame in chronological order. Timestamps are measured relative to the beginning of the frame. The event list displays all recorded events as hierarchical list (Frame -> Camera -> Nodes -> OpenGL calls).
The details panel displays multiple tabs with additional information, depending on the currently selected event in the event list. The “Capture” tab will always be displayed. It contains general information about the frame capture and additional display options. Further tabs like “Batch” are dynamic and depend on the selected node.
"Stop rendering at selected node": If this is selected and the target device is still connected, rendering on the target device will be stopped at the selected node. All nodes that appear after the selected one in the render order will be skipped.
-
If an animation is running on the target device the render order might change dynamically and results will vary.
When a node is selected in the event list, the “Note Capture” feature will be available in the toolbar. When a camera is selected in the event list, the “Camera Capture” feature will be available in the toolbar.
-
Due to the overhead associated with event recording the displayed timestamps might not accurately represent the render performance and should only be used for relative comparisons. For more accurate render performance measurements use the “Key Performance Indicators” feature of the CGI Analyzer.
Node/Camera Capture
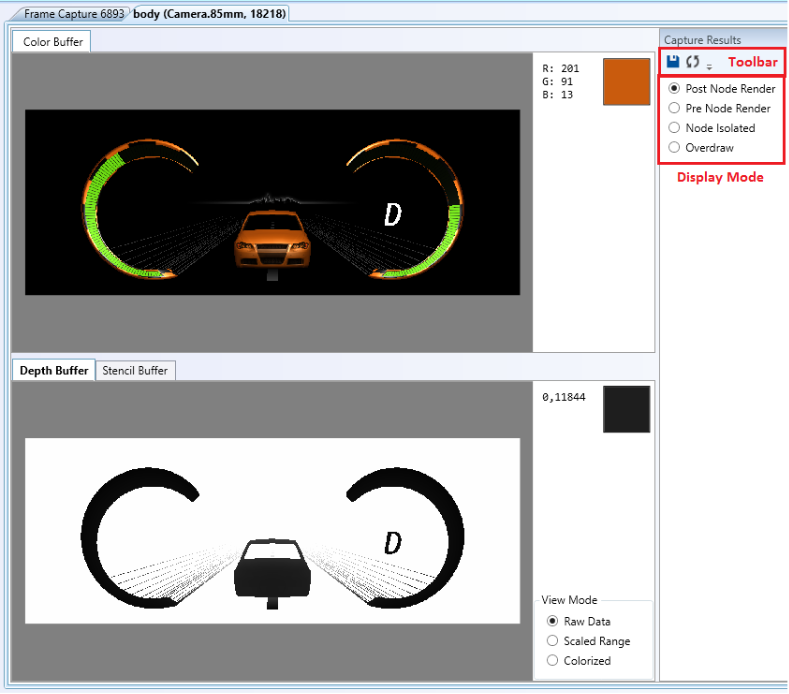
- Color Buffer:
Displays the captured color data. To the right of the image the data of the currently hovered pixel is displayed. - Depth Buffer/Stencil Buffer:
Displays the captured depth/stencil data. The currently hovered pixel is displayed to the right. View Mode can be used to display the data in different ways:- Raw Data: Show original data
- Scaled range: Scale the values in the image to use the maximum available greyscale range.
- Colorized: Computes false-color data to better visualize different data values.
- Toolbar:
- Save: Select a folder to save all captured images as PNG files.
- Refresh: Capture the same node again.
- Display Mode:
Changes the data set that is shown in the “Color Buffer” and “Depth/Stencil Buffer” sections.- Post Node Render: Framebuffer contents after the node was rendered.
- Pre Node Render: Framebuffer contents before the node was rendered.
- Node Isolated: Displays only pixel that were changed by the current node.
- Overdraw: highlight (in pink) where the current node drew over already existing pixel data.
This is not a full overdraw visualization. It is computed based on the recorded data and will not produce exact results in all circumstances (e.g. transparent pixel, depth buffer inaccuracies, …)
Image Controls
The Color/Depth/Stencil buffer view support the following controls:
- Mouse Scroll: Zoom In/Out
- Mouse Click + Drag: Move view
- Right Click: Reset view
Additionally, the tabs “Color Buffer”, “Depth Buffer” and “Stencil Buffer” can be undocked (drag & drop) to move them into separate windows and change their size.