
Analyzing the data
Bad Smells
Overview
The depth-first search analyze tools or 'Bad Smells' are tools to find abnormalities and lists several information about the currently loaded log trace.
Most information is connected to event occurrence location. The word location in the following context references to this kind of location.
Every tool can be started separately when clicking on rerun.
An entry within the found entry list can be marked as false positive either by drag and drop to defined false positive area or by context menu.
Path Allocation Count
The path allocation count lists all existing locations and its amount of allocations that happens at this location.
Based on the total amount of allocation a percentage value is created.
The summary gives information about how many locations hold more than the specified percentage threshold.
To change this threshold go to Memory Settings and choose the tab of path allocation count.
Reoccurring cluster
This tool searches for reoccurrences within the log trace. A cluster is defined as a location which is followed by one or more locations. The reoccurrence is defined by settings. When a location and its follow-ups are reoccurring over and over again, it is marked as a found entry.
The settings provide several limitations.
The maximum length of a cluster can be set to reduce calculation time.
The minimum occurrences thresholds filter more data to concentrate on most reoccurring clusters.
When a location is rarely in use, this location may always be marked as end of a cluster. This value of usage can also be specified.
Memory hold per line
This tool gives an overview of the total allocation size of each location and a brief overview of which allocations were requested.
It lists all information without thresholds because any information can be useful.
Short allocation duration
This tool shows all allocations which may be freed shortly after this allocation. The time difference can be set within the settings.
An additional summary shows all locations which hold more than a specified threshold of appearances in percentage. It also includes the amount of appearances.
Memory leak detector
This tool searches for possible memory leaks. The accuracy is based on the input data. If entries are missing or the trace ends before entire shutdown, some allocations may have no corresponding free event. Filtering the dataset also affects the output. Filtering the data can be disabled in settings.
Never used blocks
This tool searches for blocks which are created within the backing heap but are never used. This mainly happens when memory is preallocated but never used.
Block creation after init
This tool searches for blocks which are created after the preallocation or initialization.
Current Block Configuration
This tool gives a brief overview of blocks which were allocated in the backing heap. There are two different values. The first one defines the maximum block amount of a specific block size. And the second one specifies the amount of blocks which are used at the time of global time slider.
File Editor
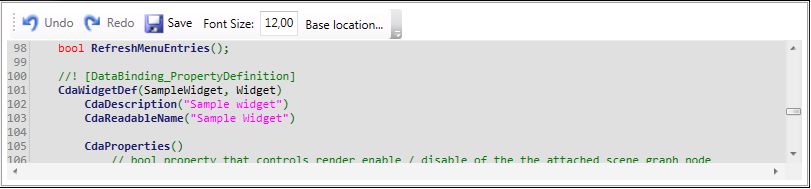
The file editor may be opened by clicking the menu button or when a highlighted filename or path is clicked.
The editor provides basic syntax highlighting. Files can be altered and saved.
-
When altering file, no syntax error check may be done.
Settings
The memory settings contain all threshold and settings which can be set. There are currently three different types of settings:
- Memory settings
- Depth-first search analyzing settings
- Filter settings
Every settings type has two default settings:
- Use filtered entries: When this flag is set currently selected filters are in use - shown dataset is removed to its selection.
- Enabled: Enables or disables the current settings. Depth-first search will not be done at load time when its enabled flag is not set but the bad smell startup is set.
The memory settings change overall settings of memory to improve usability and performance:
- Filter data while loading: previously set filter are filtering data when trace is loaded. This reduces the amount of data which may be loaded and increases performance.
It also excludes unwanted information. - Maximum loadable event entries: This value prevents the system to become irresponsible when too many entries are added. The value which should be set depends on the target system on which the program is running.
- Bad smell startup enable: Enables the calculation run of all depth-first searches after a dataset is loaded. This slow down the loading progress but you do not have to press the calculation button for every single tool and continually wait until the next tool is done with calculation.
- Line chart - Edges: When an event occurs like an allocation, the used memory does not increase like a continual signal. The increase may happen in an instance like a discrete signal. Therefore the usage over time chart is discrete. Each edge needs a second entry to be set. That results in a double amount of marker within the chart. Too many markers may slow down the system.
- Line chart - marker: Every Marker provides additional information about the current event happening at a specific position. If this information is not needed and the performance decreases drastically, it is recommended to disable the markers. Disabling the markers also change the visual impression of the chart. The detailed information is removed and the overview over the usage of time is increased.
- Line chart - resolution: The resolution affects the drawing of line within the chart. A higher value may ignore datasets when drawing the connecting line and increases performance.
Filter
Every filter type has specific flags which can be set like the enabled flag.
Additionally, every filter type contains a list of all existing filter of its type.
The time range filter is able to reduce the dataset to the selected time area.
The time ranges are based on keynotes. Additional time ranges can be created by user, too.
The thread filter filters all data of specific threads, processes or systems. If the thread name stays the same in two different traces, the system name and/or process name can be ignored. Only the thread names will be checked when filtering.
-
Normally, PID and thread IDs are given randomly by system. There is no guaranteed way to filter specific threads/processes away when loading new traces.