
Debugger
A dedicated debugger is provided as an important tool to complement the state machine modeling process. This section describes its usage.
How to Start the Debugger Panel
Open the debugger panel by selecting View > State Machine > State Machine Debugger from the menu bar.
How to Use
After opening the debugger panel, integrate it with the CGI Panel using one of the following methods and perform debugging operations.
- Start the Player Panel by clicking the Play selected scenario button on the toolbar. This launches the CGI Panel.
- From the menu bar, select State Machine > Attach... to connect to a CGI Panel that is already running.
Debugger Panel Functionality
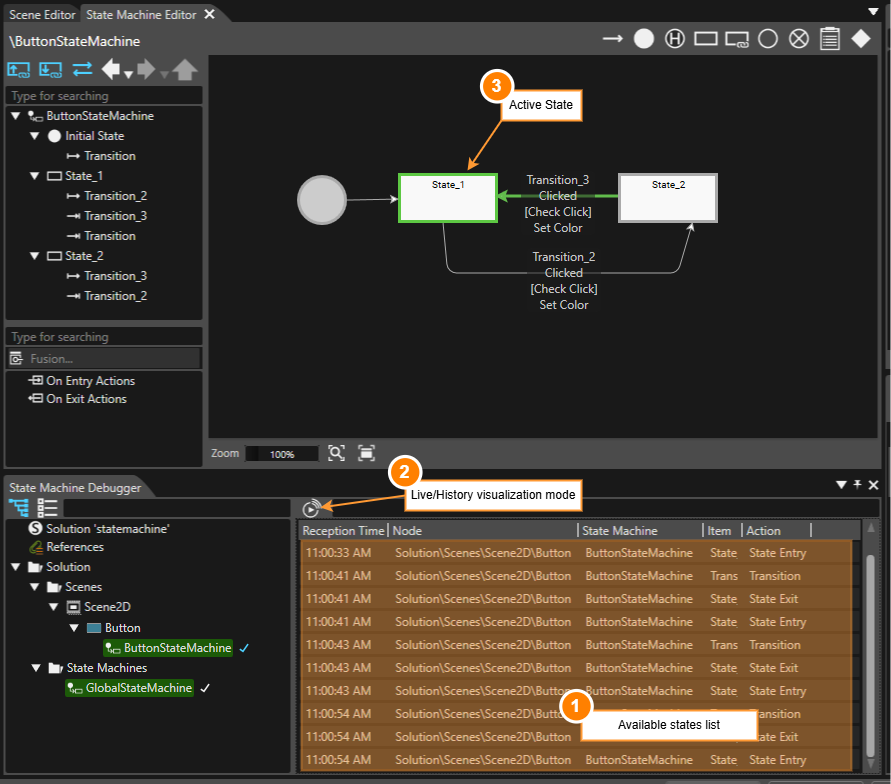
The figure above shows the debugger panel positioned directly below the State Machine Editor panel. See below for a description corresponding to the numbers in the above figure.
| 1 | Available states list | Actions are logged and listed together with a their associated Node and State or Transition. |
| 2 | Live/History visualization mode | Use this button to switch between live (real-time) and history visualization mode. |
| 3 | Active State | When the CGI Panel is running and the debugger is attached, the active state of the current State Machine is indicated in the diagram. |
This functionality makes the following tasks easier:
- Tracking Transitions
- Verifying the execution order of actions and transitions.
- Debugging State Machine logic