Controls 3.11
New Controls
BarGraph Control
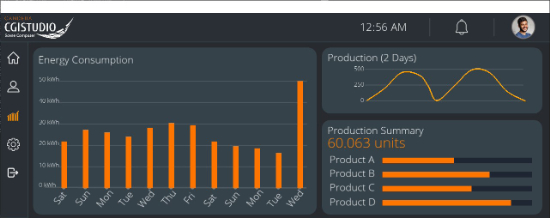
This control is a graph that presents categorical data with rectangular bars with heights proportional to the values that they represent. Used to show comparisons among two or more categories.
LineGraph Control
A line graph or curve graph is a type of chart which displays information as a series of data points connected by straight line or spline segments.