# Layout Monitor

#### <a class="anchor" id="bkmrk--27"></a>Introduction

The Layout Monitor is a feature that allows the user to see the relevant areas computed by the layouter as an overlay on top of the rendering of the application. The user can select nodes in the scene tree, the layouter rectangles are drawn automatically. The retrieval of various layout properties is available. Additionally the visualization is useful to understand how the dynamic layout is applied. The feature is available in the <span style="color: rgb(230, 126, 35);">[Player](https://doc316en.candera.eu/books/player "Player")</span>.

#### <a class="anchor" id="bkmrk--28"></a>Layout Monitor user interface

The figure below shows the Layout Monitor user interface.

<div drawio-diagram="2749"><img src="https://doc316en.candera.eu/uploads/images/drawio/2023-02/drawing-4-1677488300.png" alt=""/></div>

<div class="contents" id="bkmrk--1"><div class="contents"><div class="textblock">  
</div></div></div>In the middle of the window, all the layout trees are displayed. To customize the view, these can be individually collapsed or expanded by clicking the small arrows to the left of the layout tree. It is also possible to collapse, expand and delete all layout trees by clicking the buttons above them. By clicking the Auto-save button, all incoming layout trees will automatically be saved to a location relative to the application workspace. The individual layout trees can be expended, collapsed and deleted by right clicking on them.

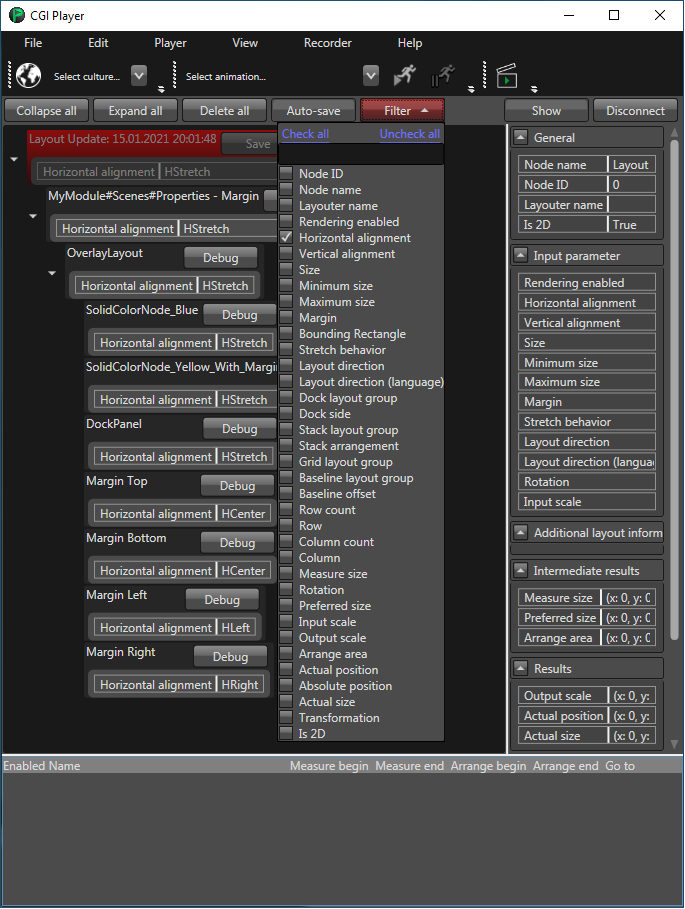
The layout trees can be filtered by clicking the Filter button as well as typing text in the textbox on top of the list. A dropdown list opens that enables choosing from various filters. These can be individually enabled or disabled. By clicking the according options in the list, all of the filters can be enabled or disabled at once as well. If a filter is enabled, it displays the according information inline with the layout tree. The figure below shows the filters available in Layout Monitor.

<div drawio-diagram="2750"><img src="https://doc316en.candera.eu/uploads/images/drawio/2023-02/drawing-4-1677488313.png" alt=""/></div>

<div class="contents" id="bkmrk--3"><div class="contents"><div class="textblock">  
</div></div></div>Clicking the Show button to the right shows the according overlay. For more information refer to <span style="color: rgb(230, 126, 35);">[Information shown in Layout Monitor](#bkmrk-information-shown-in)</span>. Clicking the Connect button connects to the target device. The connection is required always (also on host) and must be enabled before the Layout Monitor is used. The IP-Address and the Port used in connecting can be changed in the Settings window which can be opened by clicking File -&gt; Settings... as well as by opening the drop down menu to the right of the Connect button. For more information refer to Connection Setup.

<div class="contents" id="bkmrk--4"><div class="contents"><div class="textblock">  
</div></div></div>#### <a class="anchor" id="bkmrk--31"></a>Connection Setup

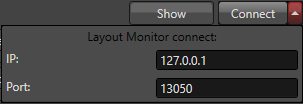
A connection to the target or to host can be established by clicking the Connect button to the right of the window. It is possible to adjust the settings of the connection by clicking the dropdown button to the right of it. In the dropdown window the IP address and the Port can be set. After the connection is established, it can receive layout trees.

<div drawio-diagram="2751"><img src="https://doc316en.candera.eu/uploads/images/drawio/2023-02/drawing-4-1677488336.png" alt=""/></div>

<div class="contents" id="bkmrk-to-produce-less-netw"><div class="contents"><div class="textblock"><dl class="note"><dt></dt><dd><p class="callout info">To produce less network traffic, disconnect and connect again to the target to receive events. This reduces network traffic considerably.</p>

</dd></dl></div></div></div>#### <a class="anchor" id="bkmrk--33"></a>Layout Monitor specific settings

In the settings window, which can be opened by clicking File -&gt; Settings... settings specific to the Layout Monitor can be changed. These settings are:

<div class="contents" id="bkmrk-the-layout-entry-dir"><div class="contents"><div class="textblock">- The Layout entry directory is the default directory for saving logs which is used by the autosave- and recording-functions.
- The Max direct children is a threshold for maximal scene tree children, it needs to be changed only when more children are required in the scene tree.
- The IP-Adress and the Port indicate where the monitor connects to.
- The coordinate grid enables and disables the coordinate grid in the overlay.

</div></div></div>#### <a class="anchor" id="bkmrk--34"></a>View Modes

The Layout Monitor mode can be used for applications that do not derive from the Player. These applications do not support all the other interfaces that would typically be required by the Player.

The Layout Monitor can be used in both of the CGIPanel modes:

<div class="contents" id="bkmrk-player-mode-layout-m"><div class="contents"><div class="textblock">- Player mode
- Layout Monitor mode (standalone mode)

</div></div></div>The mode can be selected using the View -&gt; View mode option.

<div drawio-diagram="2752"><img src="https://doc316en.candera.eu/uploads/images/drawio/2023-02/drawing-4-1677488355.png" alt=""/></div>

<div class="contents" id="bkmrk--8"><div class="contents"><div class="textblock">  
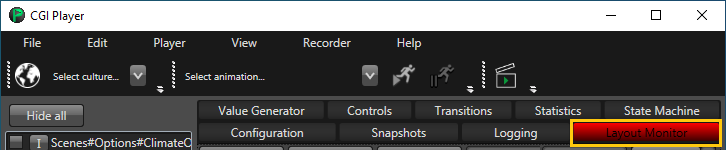
</div></div></div>In Player mode, Layout Monitor can be accessed by pressing the "Layout Monitor" button, shown in the figure below.

<div drawio-diagram="2753"><img src="https://doc316en.candera.eu/uploads/images/drawio/2023-02/drawing-4-1677488368.png" alt=""/></div>

<div class="contents" id="bkmrk--10"><div class="contents"><div class="textblock">  
</div></div></div>#### <a class="anchor" id="bkmrk--37"></a>Information shown in Layout Monitor

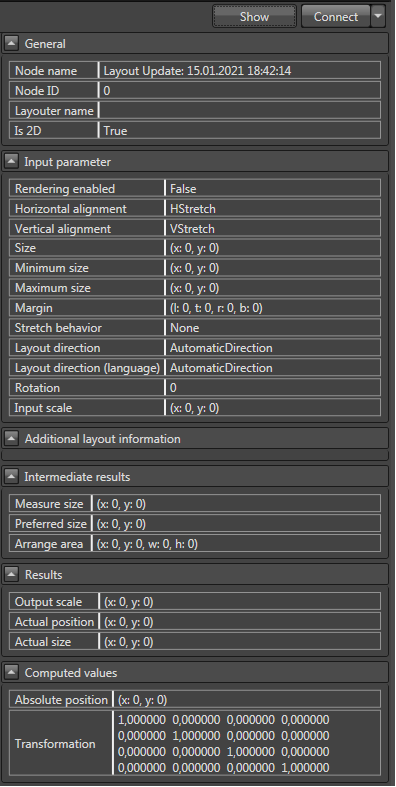
By clicking the Show button, Layout Monitor shows various information of the selected layout tree and also the overlays.

<div drawio-diagram="2754"><img src="https://doc316en.candera.eu/uploads/images/drawio/2023-02/drawing-4-1677488380.png" alt=""/></div>

<div class="contents" id="bkmrk-the-general-dropdown"><div class="contents"><div class="textblock">- The General dropdown field shows general information from the received layout tree.
- The Input parameter dropdown field shows information set within SceneComposer.
- The Additional layout information shows miscellaneous information that do not fit in the other categories.
- Intermediate values are values used as an intermediate result for the end results. 
    - For example the Measure size defines the size a node would like to have under specific layout preconditions.
- The Results section shows the final values that define the node element.
- The values shown in the Computed values dropdown field are computed directly on the host, not on the target.

</div></div></div>For every individual value there is also a tooltip available that explains the values in more detail.

By selecting nodes of the layout tree, differently colored rectangles are shown as an overlay on the screen.

<div class="contents" id="bkmrk-these-rectangles-are"><div class="contents"><div class="textblock"><dl class="note"><dt></dt><dd><p class="callout info">These rectangles are a host-only overlay. If they should be applied to an application displayed on the target, screenshots have to be used. For more information on how to make screenshots, please refer to <span style="color: rgb(230, 126, 35);">[Player](https://doc316en.candera.eu/books/player "Player")</span>. To use a screenshot with the overlay, show the screenshot and the overlay. Then move the overlay over the screenshot.</p>

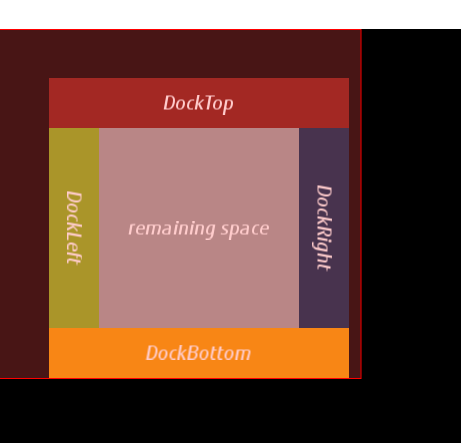
</dd></dl></div></div></div>If the top node is selected, a red rectangle appears. This rectangle can be moved freely and is to be placed atop the displayed layout. The top left corner of the overlay should be placed on the top left corner of the Player screen. This is also shown in the figure below. If the mouse is hovered above the rectangle, a tooltip appears that shows its size and position.

<div drawio-diagram="2755"><img src="https://doc316en.candera.eu/uploads/images/drawio/2023-02/drawing-4-1677488488.png" alt=""/></div>

<div drawio-diagram="2756"><img src="https://doc316en.candera.eu/uploads/images/drawio/2023-02/drawing-4-1677488528.png" alt=""/></div>

<div class="contents" id="bkmrk--14"><div class="contents"><div class="textblock">  
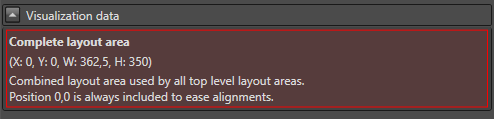
</div></div></div>Additionally to the layout, the field Visualization data appears to the right of the user interface. This field shows the size, position and a description of the overlay. To help distinguishing between the different overlays, the different entries in the visualization data section of the informations panel to the right have the same color as the according overlay. In case of the top layer overlay, the field looks as displayed in the figure below.

<div drawio-diagram="2757"><img src="https://doc316en.candera.eu/uploads/images/drawio/2023-02/drawing-4-1677488544.png" alt=""/></div>

<div class="contents" id="bkmrk--16"><div class="contents"><div class="textblock">  
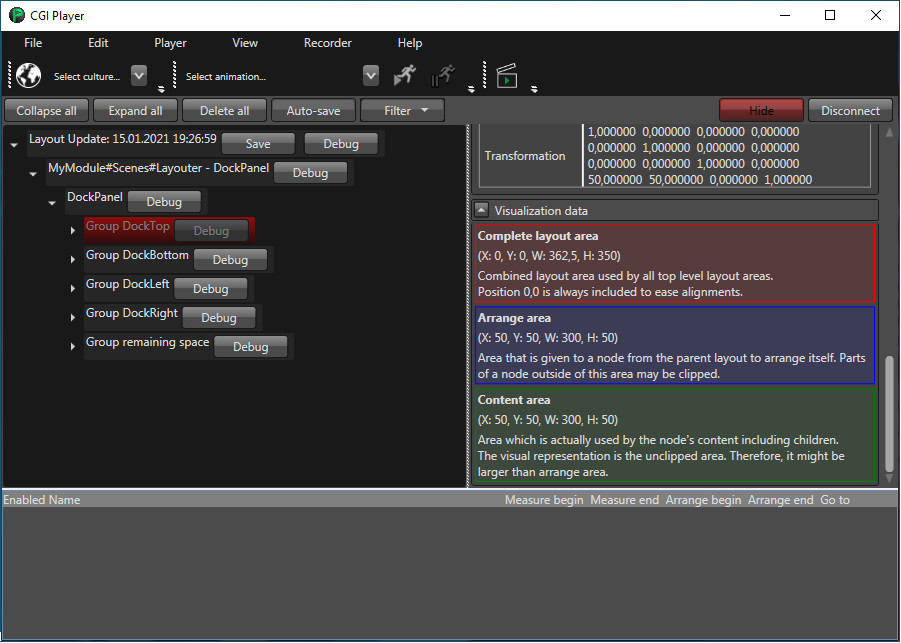
</div></div></div>If a sub-node is selected in Layout Monitor, rectangles appear that display all included parent nodes. As an example, SolidColorNode is selected. Now the Visualization data dropdown field contains three entries of the three shown overlays, their data and their description.

<div drawio-diagram="2758"><img src="https://doc316en.candera.eu/uploads/images/drawio/2023-02/drawing-4-1677488557.png" alt=""/></div>

<div class="contents" id="bkmrk--18"><div class="contents"><div class="textblock">  
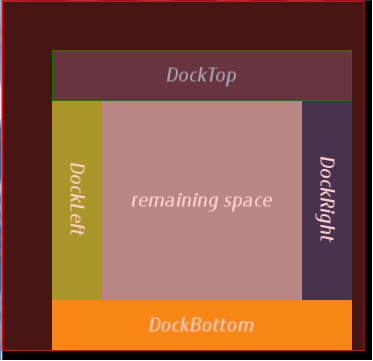
</div></div></div>Now there are three overlays that show how the layouts are set.

<div drawio-diagram="2759"><img src="https://doc316en.candera.eu/uploads/images/drawio/2023-02/drawing-4-1677488575.png" alt=""/></div>

<div class="contents" id="bkmrk--20"><div class="contents"><div class="textblock">  
</div></div></div>It is also possible to show the axis (which is important for 3D usage). The axis serves as an aid to make the alignment of the overlays easier. The axis are always positioned to the 0,0,0 position. Using the mouse to hover over the show/hide button shows a menu which allows the user to

<div class="contents" id="bkmrk-enable%2Fdisable-the-a"><div class="contents"><div class="textblock">- enable/disable the axis
- set the axis color
- enable/disable the blinking

</div></div></div>As is shown below, white lines appear which are the X and Y axis that indicate the 0/0 position and help aligning the overlay.

<div drawio-diagram="2760"><img src="https://doc316en.candera.eu/uploads/images/drawio/2023-02/drawing-4-1677488597.png" alt=""/></div>

<span style="color: rgb(34, 34, 34); font-size: 1.666em; font-weight: 400;">Debugging using Layout Monitor</span>

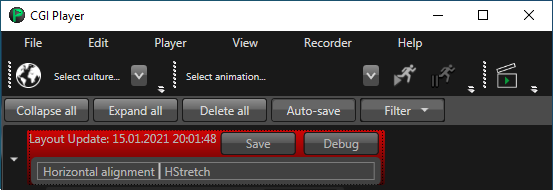
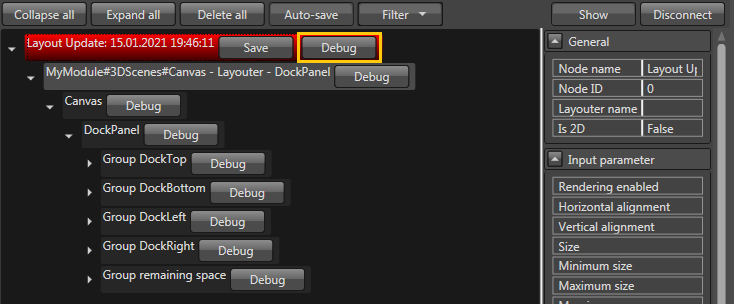
It is possible to debug either individual nodes or a parent node and its child nodes. To do this, simply press the debug button to the right of the node. If the node has child nodes, these will be debugged too.

The preconditions necessary for debugging are:

<div class="contents" id="bkmrk-debug-build-of-appli"><div class="contents"><div class="textblock">- Debug build of application
- JIT debugging must be enabled in Visual Studio
- Visual Studio must be present

</div></div></div>Activate just-in-time-debugging in Visual Studio following these steps:

<div class="contents" id="bkmrk-in-the-tools-or-debu"><div class="contents"><div class="contents"><div class="textblock">- In the Tools or Debug menu, select Options -&gt; Debugging -&gt; Just-in-time-debugger
- In the Enable Just-in-time debugging settings, ensure that "Native" is enabled

</div></div></div></div><div drawio-diagram="2761"><img src="https://doc316en.candera.eu/uploads/images/drawio/2023-02/drawing-4-1677488618.png" alt=""/></div>

<div class="contents" id="bkmrk--23"><div class="contents"><div class="textblock">  
</div></div></div>Clicking the debug button will cause breakpoints to appear on the bottom of the window. In this example, two breakpoints are set.

<div drawio-diagram="2762"><img src="https://doc316en.candera.eu/uploads/images/drawio/2023-02/drawing-4-1677488642.png" alt=""/></div>

<div class="contents" id="bkmrk--25"><div class="contents"><div class="textblock">  
</div></div></div>There are several options available for setting up breakpoints, which can be enabled or disabled using the checkoxes, as indicated in the Figure above. The options are:

<div class="contents" id="bkmrk-enabled%3A-breaks-when"><div class="contents"><div class="textblock">- Enabled: breaks when node rendering is enabled or disabled
- Measure begin: breaks at the beginning of the measurement phase
- Measure end: breaks at the end of the measurement phase
- Arrange begin: breaks at the beginning of the arrange phase
- Arrange end: breaks at the end of the arrange phase
</div></div></div>The breakpoints are actual code breakpoints so that Visual Studio is opened.

The Go to button selects the node in the layout tree.

To completely remove a breakpoint, select it so that it is marked blue and press the Delete button on the keyboard.

<div class="contents" id="bkmrk--26"><div class="contents"><div class="textblock">  
</div></div></div>#### <a class="anchor" id="bkmrk--47"></a>Saving the layout tree

It is possible to save the layout tree by clicking the Save button to the right of the main layout tree. It is then persistently available. Drag and drop can be used to import the previously saved tree into the Layout Monitor.

<div class="contents" id="bkmrk-how-to-integrate-lay"><div class="contents"><div class="textblock"><a class="anchor" id="bkmrk--48" style="font-size: 1.666em; font-weight: 400; background-color: rgb(255, 255, 255);"></a><span style="color: rgb(34, 34, 34); font-size: 1.666em; font-weight: 400;">How to integrate Layout Monitor in existing custom applications</span></div></div></div>As a tutorial on how to integrate Layout Monitor into a custom application, please see following code sample:

LayoutMonitor.h must be included:

```
// Main include
#include <Candera/System/Diagnostics/LayoutMonitor.h>

// includes for the threading
#include <FeatStd/Platform/TcpServer.h>
#include <FeatStd/Platform/CriticalSectionLocker.h>
#include <FeatStd/Platform/Thread.h>
```

```
class LayoutMonitorListener : public FeatStd::<a class="code" href="http://dev.doc.cgistudio.at/APILINK/group___behaviors_streaming.html#gga41ee1974636ac915b2bb962b44b12d30a345837cc698bea28ddcab8ed70fe38f8">Internal</a>::Thread {
    public:
        static LayoutMonitorListener& GetInstance()
        {
            <a class="code" href="http://dev.doc.cgistudio.at/APILINK/group___f_e_a_t_s_t_d___u_t_i_l_s.html#gae1db64745d2bd9b3b672088ff6d6038d">FEATSTD_UNSYNCED_STATIC_OBJECT</a>(LayoutMonitorListener, s_inst);
            return s_inst;
        }

        void <a class="code" href="http://dev.doc.cgistudio.at/APILINK/group___c_o_u_r_i_e_r___v_i_s_u_a_l_i_z_a_t_i_o_n.html#ggaebf7a2d5677fc4e6ddcb367db56e9c15a6f88b2990f5bd9559bc93594e207c7a0">Stop</a>()
        {
            {
                FeatStd::Internal::CriticalSectionLocker l(&m_memberSection);
                if (m_server != 0) {
                    m_server->Close();
                }
            }
            Candera::Diagnostics::LayoutMonitor::CloseStream();
        }

        bool <a class="code" href="http://dev.doc.cgistudio.at/APILINK/group___c_o_u_r_i_e_r___v_i_s_u_a_l_i_z_a_t_i_o_n.html#ggaebf7a2d5677fc4e6ddcb367db56e9c15a98a68208805c7b182b3d1cf569c78a2c">Start</a>(FeatStd::UInt32 port)
        {
            if (CreateServer(port)) {
                return Run();
            }
            return false;
        }

        LayoutMonitorListener() :m_server(0)
        {
            Candera::Diagnostics::LayoutMonitor::Register();
        }

        ~LayoutMonitorListener()
        {
            Candera::Diagnostics::LayoutMonitor::Unregister();
        }
    protected:
        bool CreateServer(FeatStd::UInt32 port)
        {
            FeatStd::Internal::CriticalSectionLocker l(&m_memberSection);
            if (m_server != 0) {
                return false;
            }
            m_server = <a class="code" href="http://dev.doc.cgistudio.at/APILINK/group___c_o_u_r_i_e_r___v_i_s_u_a_l_i_z_a_t_i_o_n.html#ggaf0e93dc4242f607c3c8d13dafd036af9aaabfa5309af24986d3111a092449f857">FeatStd::Internal::TcpServer::Create</a>(port);
            return m_server != 0;
        }

        virtual FeatStd::Int ThreadFn() override
        {
            do {
                FeatStd::Internal::IO::Stream * localStream = m_server->Accept();
                if (localStream != 0) {
                    Candera::Diagnostics::LayoutMonitor::Run(<a class="code" href="http://dev.doc.cgistudio.at/APILINK/group___c_o_u_r_i_e_r___v_i_s_u_a_l_i_z_a_t_i_o_n.html#ggaf0e93dc4242f607c3c8d13dafd036af9aaabfa5309af24986d3111a092449f857">FeatStd::Internal::IO::SharedStream::Create</a>(localStream));
                }
            } while (m_server->IsOpen());
            if (m_server != 0) {
                FeatStd::Internal::CriticalSectionLocker l(&m_memberSection);
                <a class="code" href="http://dev.doc.cgistudio.at/APILINK/group___f_e_a_t_s_t_d___m_e_m_o_r_y_m_a_n_a_g_e_m_e_n_t.html#ga77c7cc80df42d2d20c29c3f8c9d46858">FEATSTD_SAFE_DELETE</a>(m_server);
            }
            Candera::Diagnostics::LayoutMonitor::CloseStream();
            return 0;
        }
    private:
        mutable FeatStd::Internal::CriticalSection m_memberSection;
        FeatStd::Internal::TcpServer * m_server;
    };
```

To start the monitor:

```
return LayoutMonitorListener::GetInstance().Start(CGIAPP_LAYOUTMONITOR_PORT); // default port: 13050
```

To stop the monitor:

```
LayoutMonitorListener::GetInstance().Stop();
```