# Performance Analysis > Howto Instrument for Performance Measurement

#### <a class="anchor" id="bkmrk--17"></a>Performance Measurement with Analyzer

This document shall convey the basics of performance measurement instrumentation.

#### **General Setup**

##### **Project Setup** 

Copy your own project folder to your CGI Studio root folder (containing for example the [Candera](http://dev.doc.cgistudio.at/APILINK/namespace_candera.html "[DataBinding_RefTypeSample]") folder named cgi\_studio\_candera) named &lt;CGI-STUDIO-ROOT&gt;.

Point CMake GUI "Where is the source code" to the location of your source code.

Select an arbitrary folder for "Where to build the binaries".   
After pressing "configure", following [Candera](http://dev.doc.cgistudio.at/APILINK/namespace_candera.html "[DataBinding_RefTypeSample]") Performance Measurement specific CMake flags can be configured:

<div class="contents" id="bkmrk-featstd_monitor_type"><div class="contents"><div class="textblock"><table class="doxtable" style="width: 100%; height: 434.749px;"><tbody><tr style="height: 102.562px;"><td style="width: 21.5991%; height: 102.562px;" valign="top">FEATSTD\_MONITOR\_TYPE</td><td style="width: 64.1435%; height: 102.562px;" valign="top">Enables or disables [Candera](http://dev.doc.cgistudio.at/APILINK/namespace_candera.html "[DataBinding_RefTypeSample]") Monitor component and [Candera](http://dev.doc.cgistudio.at/APILINK/namespace_candera.html "[DataBinding_RefTypeSample]") performance monitoring instrumentation macros.

By default, [Candera](http://dev.doc.cgistudio.at/APILINK/namespace_candera.html "[DataBinding_RefTypeSample]") is configured to not include instrumentation on graphics engine level.

</td><td style="width: 14.1338%; height: 102.562px;" valign="top">On / Off</td></tr><tr style="height: 137.203px;"><td style="width: 21.5991%; height: 137.203px;" valign="top">FEATSTD\_MONITOR\_TCPIP\_ADDRESS

FEATSTD\_MONITOR\_TCPIP\_PORT

</td><td style="width: 64.1435%; height: 137.203px;" valign="top">If FEATSTD\_MONITOR\_TYPE is set to FEATSTD\_COM\_TYPE\_TCPIP , TCP/IP online connection to be established with Analyzer can be configured.

Default:

- localhost (127.0.0.1)
- 13047

</td><td style="width: 14.1338%; height: 137.203px;" valign="top">TCP/IP Address and Port

</td></tr><tr style="height: 137.203px;"><td style="width: 21.5991%; height: 137.203px;" valign="top">FEATSTD\_MONITOR\_SERIALPORT\_ADDRESS

FEATSTD\_MONITOR\_SERIALPORT\_BAUDRATE

</td><td style="width: 64.1435%; height: 137.203px;" valign="top">If FEATSTD\_MONITOR\_TYPE is set to FEATSTD\_COM\_TYPE\_SERIALPORT , Serial port online connection to be established with Analyzer can be configured.

Default:

- empty
- Baud: 9600

</td><td style="width: 14.1338%; height: 137.203px;" valign="top">Serial COM Port and Baudrate</td></tr><tr style="height: 57.7812px;"><td style="width: 21.5991%; height: 57.7812px;" valign="top">CANDERA\_PERFORMANCE\_RECORDER\_DISABLED</td><td style="width: 64.1435%; height: 57.7812px;" valign="top">Enables or disables [Candera](http://dev.doc.cgistudio.at/APILINK/namespace_candera.html "[DataBinding_RefTypeSample]") performance instrumentations.

Default: Off

</td><td style="width: 14.1338%; height: 57.7812px;" valign="top">On / Off</td></tr></tbody></table>

</div></div></div>Performance recording functionality is exposed by macros; hence no performance recording code will be included in [Candera](http://dev.doc.cgistudio.at/APILINK/namespace_candera.html "[DataBinding_RefTypeSample]") and [Candera](http://dev.doc.cgistudio.at/APILINK/namespace_candera.html "[DataBinding_RefTypeSample]") application builds, if performance recording is disabled.

In this tutorial, instead of using a TCP/IP online connection, performance log data is being written to a local file. In this case, performance log data needs to be transferred to Analyzer tool manually, i.e. via TFTP from target to host.

And the following cmake setting were chosen:

```
FEATSTD_MONITOR_TYPE = FEATSTD_COM_TYPE_FILE_DUMP
```

#####   
**Program Skeleton (Recording to File)** 

For this tutorial, the following program skeleton is used:

```
#include <stdio.h>
#include <time.h>
#include <Candera/System/Monitor/PerfMonPublicIF.h>
#include <FeatStd/Monitor/PerformanceRecording/FileDumper.h>

using namespace Candera;
using namespace FeatStd::PerfMon;

int main(int argc, char *argv[])
{
    // activate recording
    CANDERA_PERF_SET_ENABLED(true);
   
    FileDumper::Open("c:\\temp\\tutorial.perflog");

    // BEGIN do the recording here

    // END do the recording here

    // Flush recording buffer at regular, small intervals to prevent buffer overflow
    FileDumper::Flush();
    // Close file and open new file in order to keep performance log files small
    FileDumper::FlushAndClose();

    fgetc(stdin);

    return 0;
}
```

Important is the activation of recording. Without this line, no performance recording will be written to the recording buffer.

The call to `FeatStd::PerfMon::FileDumper::Open` opens the file to write to. `FeatStd::PerfMon::FileDumper::Flush` writes the data recorded in the buffer to the file, if possible. `FeatStd::PerfMon::FileDumper::FlushAndClose` calls `DumpFile::Flush`, just in case, and closes the file.

The performance log API was designed with different storage media and transport mechanisms in mind. As you can see from the following code snippet, the function `FeatStd::PerfMon::FileDumper::Flush` calls the function `FeatStd::PerfMon::Controller::DumpPerfData` and passes a pointer to a member function to it. This function is called in return to actually write data to the provided mechanism, in this case, to a file.

```
static void Flush()
{
    FEATSTD_PERF_DUMP_DATA(FlushLog, false, 0);
}
```

#####   
**Program Skeleton (Recording to Memory)** 

The following code snippet shows the program skeleton for recording to memory:

```
#include <stdio.h>
#include <time.h>
#include <Candera/System/Monitor/PerfMonPublicIF.h>
#include <FeatStd/Monitor/PerformanceRecording/MemoryDumper.h>

using namespace Candera;
using namespace FeatStd::PerfMon;

int main(int argc, char *argv[])
{
    const UInt32 perflogLength = 256;
    UInt8 perflog[perflogLength];

    // set destination for recording
    MemoryDumper::Initialize(perflog, perflogLength);

    // activate recording
    CANDERA_PERF_SET_ENABLED(true);
   
    // BEGIN do the recording here

    // END do the recording here

    // Flush recording buffer at regular, small intervals to prevent buffer overflow
    MemoryDumper::Flush();

    // Print performance log location and size to provided stream 
    // (default: std::cout) and disable performance log recording
    // A breakpoint has to be set here to prevent recorded data from being overwritten
    MemoryDumper::Dump();

    // Reset the dumper to restart recording
    <a class="code" href="http://dev.doc.cgistudio.at/APILINK/group___c_o_u_r_i_e_r___v_i_s_u_a_l_i_z_a_t_i_o_n.html#ggaf0e93dc4242f607c3c8d13dafd036af9a0755a8454bc3924584f1f0cddc65f7b6">MemoryDumper::Clear</a>();

    // re-activate recording; 
    CANDERA_PERF_SET_ENABLED(true);

    fgetc(stdin);

    return 0;
}
```

Recording to memory is done similar to recording to file. Instead of closing the old file and opening a new one, the storage location along with the length of the performance log is dumped (written) to a specified stream (defaulting to `std::cout`) using the function `FeatStd::PerfMon::MemoryDumper::Dump()`. Performance log recording is automatically disabled at this point. A breakpoint has to be set here to stop the application and copy the performance log from memory to a file for opening with Analyzer. To continue recording, the performance log dumper has to be reset using the function `<a class="el" href="http://dev.doc.cgistudio.at/APILINK/group___c_o_u_r_i_e_r___v_i_s_u_a_l_i_z_a_t_i_o_n.html#ggaf0e93dc4242f607c3c8d13dafd036af9a0755a8454bc3924584f1f0cddc65f7b6">FeatStd::PerfMon::MemoryDumper::Clear()</a>` to re-start recording at the beginning of the user-provided buffer.

####    
**Recording of Performance Values** 

##### **Using Event Recorders** 

Event Recorders are the simplest recorders. They just record events at given points in time.   
Their usage is straight forward:

```
...
CANDERA_PERF_RECORD_EVENT(EventRecId::Application0);
...
```

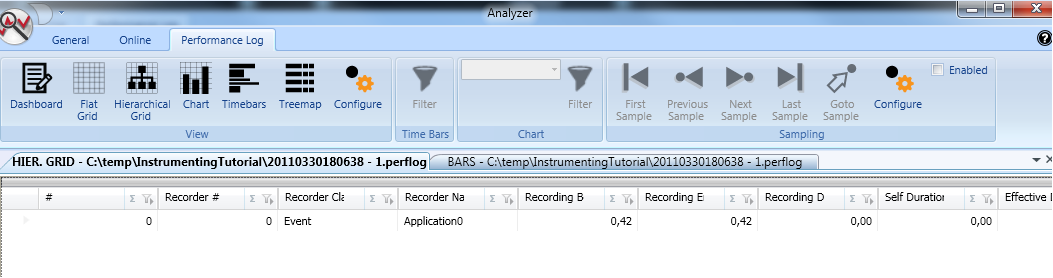
Here, an event with event id Application0 is recorded. The namespace EventRecId is defined in the file Recorder.h. If we compile and run our application, a performance log file is created with just this one recording.

We can now open this file in Analyzer. In the Flat / Hierarchical Grid View (Figure 1), as well as in the Time Bars View, the recording can be inspected. It is possible to change the predefined recorder name for display using the Configuration Dialog from the View Ribbon Bar. You have to reopen the performance log for the changes to take effect.

<div drawio-diagram="2730"><img src="https://doc316en.candera.eu/uploads/images/drawio/2023-02/drawing-4-1677474167.png" alt=""/></div>

<div class="contents" id="bkmrk--0"><div class="textblock"><div class="image">  
</div></div></div>##### **Using Value Recorders** 

Value recorders can record integral numbers (positive and negative). The example below shows a succession of value recordings.

```
...
CANDERA_PERF_RECORD_VALUE(ValueRecId::Application0, 10);
busywait();
CANDERA_PERF_RECORD_VALUE(ValueRecId::Application0, 10);
busywait();
CANDERA_PERF_RECORD_VALUE(ValueRecId::Application0, 10);
busywait();s
CANDERA_PERF_RECORD_VALUE(ValueRecId::Application0, 10);
busywait();
...
```

As with event recorders, value recorders are identified by their id. The namespace ValueRecId is again defined in the file Recorder.h. In addition to the id, the value to record is passed to the recording function. The function busywait() waits in a loop for some time to pass, just to make things more interesting.

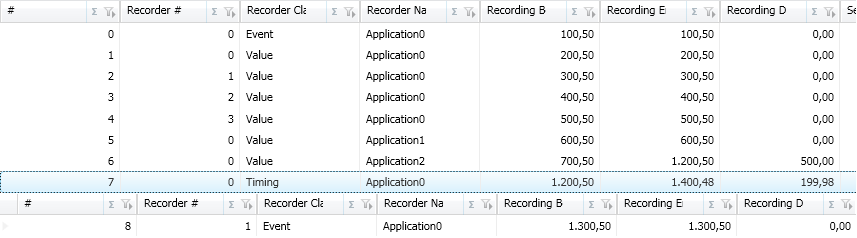
Opening the new performance log in Analyzer now shows five recordings (one event and four values). The "Value" column shows the value 10 for each value recorder (Figure below).

<div drawio-diagram="2731"><img src="https://doc316en.candera.eu/uploads/images/drawio/2023-02/drawing-4-1677474210.png" alt=""/></div>

<div class="contents" id="bkmrk--2"><div class="contents"><div class="textblock"><div class="image">  
</div></div></div></div>"The Absolute Value" column shows also the values 10. This is the case, because as a default, Analyzer assumes as relationship between recorded values "Unrelated". To regard the values of a value recorder as related, the value relationship "Differential" has to be set. This can be accomplished again via the Configuration Dialog from the View Ribbon Bar. Remember to close and reopen the performance log after changing settings. Figure 3 shows the value recordings of recorder Application0, interpreted as having the relationship "Differential". The "Value" column is still the same, but the "Absolute" column shows, that each recording has its recorded value added to the value of its predecessor.

<div drawio-diagram="2732"><img src="https://doc316en.candera.eu/uploads/images/drawio/2023-02/drawing-4-1677474227.png" alt=""/></div>

<div class="contents" id="bkmrk--4"><div class="contents"><div class="textblock"><div class="image">  
</div></div></div></div>Let's add another value recorder:

```
...
CANDERA_PERF_RECORD_VALUE(ValueRecId::Application1, -50);
busywait();
...
```

If we run our program again and view the new performance log in Analyzer, we see the following:

<div drawio-diagram="2733"><img src="https://doc316en.candera.eu/uploads/images/drawio/2023-02/drawing-4-1677474248.png" alt=""/></div>

<div class="contents" id="bkmrk--6"><div class="contents"><div class="textblock"><div class="image">  
</div></div></div></div>What happened? The problem here is, that Analyzer interprets a recorded value by default as positive long value. In order to interpret it correctly, we have to help Analyzer by using the Configuration Dialog from the View Ribbon Bar. By checking the checkbox labeled "Data values are signed" for the value recorder Application1, the values will from now on be interpreted correctly. Remember to reopen the performance log for the changes to take effect (Figure below).

<div drawio-diagram="2734"><img src="https://doc316en.candera.eu/uploads/images/drawio/2023-02/drawing-4-1677474261.png" alt=""/></div>

<div class="contents" id="bkmrk--8"><div class="textblock"><div class="image">  
</div></div></div>#####   
**Using Cumulative Value Recorders** 

The listing below shows the usage of a Cumulative Value Recorder with an annotation. An annotation is a way to differentiate between different flavors of the same recorder.

```
...
{
    CANDERA_PERF_RECORDER(CumulativeValue, (ValueRecId::Application2, "cumval"));
    busywait();
    CANDERA_PERF_RECORD_VALUE(ValueRecId::Application2, 10);
    busywait();
    CANDERA_PERF_RECORD_VALUE(ValueRecId::Application2, 20);
    busywait();
    CANDERA_PERF_RECORD_VALUE(ValueRecId::Application2, 30);
    busywait();
    CANDERA_PERF_RECORD_VALUE(ValueRecId::Application2, 40);
    busywait();
}
...
```

A Cumulative Value Recorder has to be instantiated. This is done with the first statement. All further references to this recorder add the respective values to the existing recording entry and do not instantiate new recording entries. In order for this to work, the references to the Cumulative Value Recorder have to be in the same block, or a sub-block. The image below shows the new result of the recording in Analyzer.

<div drawio-diagram="2735"><img src="https://doc316en.candera.eu/uploads/images/drawio/2023-02/drawing-4-1677474296.png" alt=""/></div>

<div class="contents" id="bkmrk--10"><div class="contents"><div class="textblock"><div class="image">  
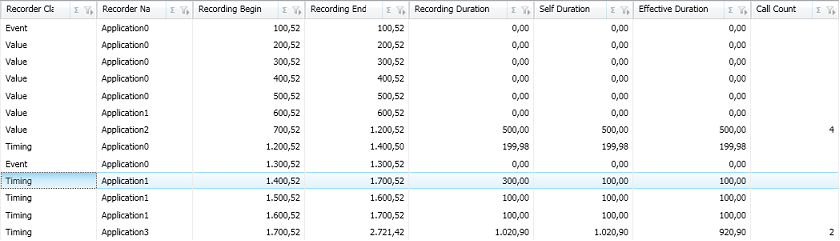
</div></div></div></div>We see, that the values are summed-up and the value of "Call Count" is 4, the number of recordings.

#####   
**Using Timing Recorders** 

Timing Recorders are, as the name implies, used to measure time. The time is measured in relation to the execution block where they are used. The life of a Timing Recorder ends with its execution block, as does the time measurement. Listing 8 shows the usage of a Timing Recorder.

```
...
{
    CANDERA_PERF_RECORDER(Timing, (TimingRecId::Application0));
    busywait();

    CANDERA_PERF_RECORD_EVENT(EventRecId::Application0);
    busywait();
}
...
```

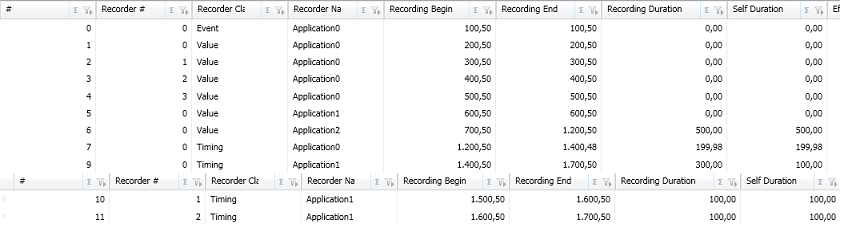
Timing Recorders have to be instantiated. Everything (direct or called) in the same execution block contributes to the measured time. Also, all recordings in this execution block are regarded as being nested, being child recordings of the timing recording. The figure below shows the Hierarchical Grid View in Analyzer.

<div drawio-diagram="2736"><img src="https://doc316en.candera.eu/uploads/images/drawio/2023-02/drawing-4-1677474328.png" alt=""/></div>

<div class="contents" id="bkmrk--12"><div class="contents"><div class="textblock"><div class="image">  
</div></div></div></div>A Timing Recorder can have further Timing Recorders in its execution block. What we gain here is a call stack-like hierarchy of recordings. The listing below shows the code snippet and the next figure shows the performance log opened in Analyzer.

<div drawio-diagram="2737"><img src="https://doc316en.candera.eu/uploads/images/drawio/2023-02/drawing-4-1677474408.png" alt=""/></div>

<div class="contents" id="bkmrk--14"><div class="textblock"><div class="image">  
</div></div></div>#####   
**Using Cumulative Timing Recorders** 

Cumulative Timing Recorder, as Cumulative Value Recorder, store one value per left execution block only. The listing below shows the usage and the next figure shows the result of this instrumentation in Analyzer. Cumulative Timing Recorders have to be instantiated.

```
...
{
    CANDERA_PERF_RECORDER(Timing, (TimingRecId::Application3, true));
    busywait();

    {
        {
            CANDERA_PERF_RECORDER(Timing, (TimingRecId:: Application3));
            busywait();
        }
        {
            CANDERA_PERF_RECORDER(Timing, (TimingRecId:: Application3));
            busywait();
        }
    }
}    
...
```

<div drawio-diagram="2738"><img src="https://doc316en.candera.eu/uploads/images/drawio/2023-02/drawing-4-1677474494.png" alt=""/></div>

<div class="contents" id="bkmrk--16"><div class="textblock"><div class="image">  
</div></div></div>##### **Using Asynchronous Timing Recorders** 

Asynchronous Timing Recorders are the only timing recorders whose recordings can outlive them. An Asynchronous Timing Recorder has to be instantiated and the end of the recording operation has to signaled explicitely (Listing below).

```
...

{
    // Start recording of ansychronous timing.
    CANDERA_PERF_RECORDER(AsyncTiming, (AsyncTimingRecId::Application0));
    busywait();
}

...

// End of asynchronous recording, outside of creation scope
CANDERA_PERF_ASYNCREC_FINISHED(AsyncTimingRecId::Application0);

...
```