# Obtaining data

#### **Traceable data: Which data will be traced?** 

##### <a class="anchor" id="bkmrk--2"></a>Allocating and releasing memory

The most important part of this Analyzer module is tracing all allocation and free calls within the code. That includes normal allocation/free calls as well as allocations in the Backing Heap.

The used terminology within the Analyzer is:

<div class="contents" id="bkmrk-allocate-memory-%3C-%3E-"><div class="contents"><div class="textblock">- Allocate memory &lt;-&gt; Alloc
- Free memory &lt;-&gt; Free
- Allocate in Backing Heap &lt;-&gt; Create
- Free Backing Heap Space &lt;-&gt; Destroy

</div></div></div>##### <a class="anchor" id="bkmrk--3"></a>Informational data

<div class="contents" id="bkmrk-this-feature-is-not-"><div class="contents"><div class="textblock"><dl class="note"><dt></dt><dd><p class="callout info">This feature is not added to a public interface yet.</p>

</dd></dl></div></div></div>Additional to these four existing types are several information types.  
These informations are used to provide more information and are generally used as orientation and filter helpers.

List of information types:

<div class="contents" id="bkmrk-allocation-failed-me"><div class="contents"><div class="textblock">- Allocation failed message: Contains information of the failed request
- Warning message
- Error message - Possible types: textual message or error code
- Info message: Supports different priority levels additional to the message
- Start and end marker: Defines a named time range

</div></div></div>##### <a class="anchor" id="bkmrk--4"></a>Start and end marker

These marker define a specified timespan within application runtime.   
Example: Encapsulate the render loop. Based on these markers it is easy to find out which memory changes happened every single loop iteration.

#### **Retrieving data** 

##### <a class="anchor" id="bkmrk--5"></a>Binary memory logging

The standard way to log memory changes is to enable it with CMake.  
To enabled it you have to complete the following steps:

<div class="contents" id="bkmrk-enable-memorypools-f"><div class="contents"><div class="textblock">- Enable MemoryPools ```
    <a class="code" href="http://dev.doc.cgistudio.at/APILINK/group___f_e_a_t_s_t_d___c_o_n_f_i_g.html#ga6e3f7a95a0d06b38bb0c255dd80ecb3a">FEATSTD_MEMORYPOOL_ENABLED</a> true
    ```
- Enable monitoring ```
    <a class="code" href="http://dev.doc.cgistudio.at/APILINK/group___f_e_a_t_s_t_d___c_o_n_f_i_g.html#gaa5831e2f6fa8672573f44659e5208a0d">FEATSTD_MONITOR_ENABLED</a> true
    ```
- Enable memory binary logging ```
    MONITOR_MEMORYPOOL_BINARY_LOGGING_ENABLED true
    ```

</div></div></div>Optional:

<div class="contents" id="bkmrk-change-filename-moni"><div class="contents"><div class="textblock">- Change filename ```
    MONITOR_MEMORYPOOL_BINARY_LOGGING_FILENAME "filename.membin"
    ```

</div></div></div><div class="contents" id="bkmrk-only-logging-into-a-"><div class="contents"><div class="textblock"><dl class="note"><dd><p class="callout info">Only logging into a file is currently supported. Turning off Performance Recording whilst logging memory changes is currently not supported yet. Using TCP/IP or Serial without an established connection (and therefore Performance Recording is ignored) is working though.</p>

</dd></dl></div></div></div>##### <a class="anchor" id="bkmrk--6"></a>Textual memory logging

It is possible to load a trace-log of your Logger into the Analyzer. There are a few required steps to make it work.

<div class="contents" id="bkmrk-the-logger-has-to-be"><div class="textblock">- The logger has to be enabled
- The messages are sent as DEBUG messages. So the logging level has to be DEBUG as minimum. ```
     <a class="code" href="http://dev.doc.cgistudio.at/APILINK/group___f_e_a_t_s_t_d___d_i_a_g_n_o_s_t_i_c_s.html#gaed9977d4815267bd05e7dcee49f94f4b">FEATSTD_LOG_SET_LOG_LEVEL</a>(<a class="code" href="http://dev.doc.cgistudio.at/APILINK/group___f_e_a_t_s_t_d___d_i_a_g_n_o_s_t_i_c_s.html#ggad2cbc908487f2a3b4340020c0f69bda0af5dfc3720ca935220d7c86cf1bb2aa27" title="Debug.">Debug</a>);
    ```
    
    <dl class="note"><dd><p class="callout info">Set the log level as soon as possible. All allocations before will not be traced, this also includes the memory pool preinitialization.</p>
    
    </dd></dl>
- The messages have to keep their default format: ```
    // sample for heap alloc
    0000000.025 [0x00000000] DEBUG FeatStdMemoryManagement FeatStdDefaultMemoryPool(0) heap alloc 0E2A93D0(24:P)
    // sample for alloc memory
    0000000.026 [0x00000000] DEBUG FeatStdMemoryManagement \featstd\src\FeatStd/Container/Vector.h(696): FeatStdDefaultMemoryPool(0) alloc 0E2A93E0 8(24:P)
    // sample for free memory
    0000000.027 [0x00000000] DEBUG FeatStdMemoryManagement \featstd\src\FeatStd/Container/Vector.h(696): FeatStdDefaultMemoryPool(0) free 0E2A93E0 8(24:P)
    // sample for heap free
    0000000.028 [0x00000000] DEBUG FeatStdMemoryManagement FeatStdDefaultMemoryPool(0) heap free 0E2A93D0(24:P)
    ```
    
    <dl class="note"><dd><p class="callout info">CgiAppLogger replaces the default logger and changes the format for DEBUG messages.</p>
    
    </dd></dl>
- To trace all possible data, it is important to create the LogAppender before initializing memory pools and destroy it afterwards.
- The file extension for these files has to be '\*.memlog'

</div></div><div class="contents" id="bkmrk-all-the-other-messag"><div class="textblock"><dl class="note"><dd><p class="callout info">All the other message types: <span style="color: rgb(230, 126, 35);">[info, warning, error, start/end marker](#bkmrk-traceable-data%3A-whic-0)</span> are not available when using these textual logs.</p>

</dd></dl></div></div>#### **Loading data** 

All logfiles can be loaded by clicking the application menu button -&gt; open -&gt; Open Memory-Log or by Drag'n'Drop.  
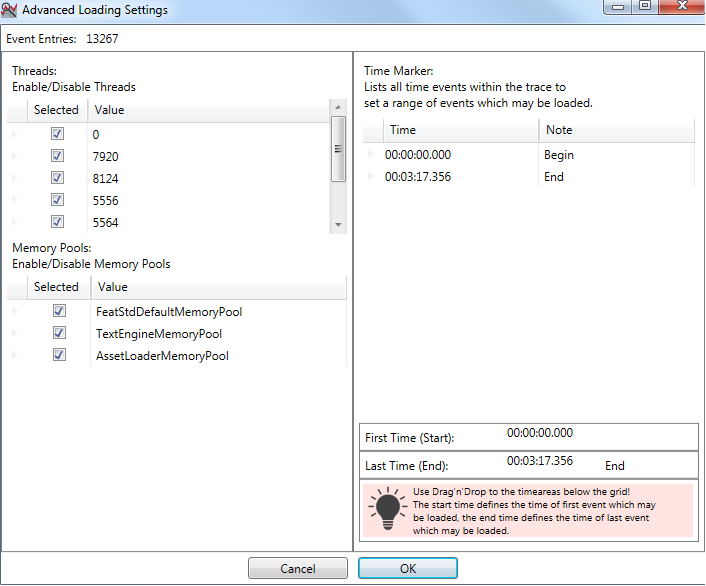
When loading a binary log file, a loading window will open after preanalyzing the content of the log file.

<div drawio-diagram="2983"><img src="https://doc316en.candera.eu/uploads/images/drawio/2023-03/drawing-4-1677747175.png" alt=""/></div>

<div class="contents" id="bkmrk--0"><div class="contents"><div class="textblock">  
</div></div></div>This window gives information about the logfile and allows to prefilter the dataset.  
It is possible to:

<div class="contents" id="bkmrk-disable-threads-disa"><div class="textblock">- Disable threads
- Disable memory pools
- Set a time range based on all recorded time marker. Use Drag'n'Drop to place a time marker on 'Start' or 'End'.

</div></div><div class="contents" id="bkmrk-large-log-files-may-"><div class="textblock"><dl class="note"><dt><p class="callout info">Large log files may slow down the analyzer drastically. The MemoryPool-Analyzer settings contains a property to set a cap for maximum loaded entries</p>

</dt></dl></div></div><div class="contents" id="bkmrk--8"></div>