# Measurement User Interface

#### **User Interface** 

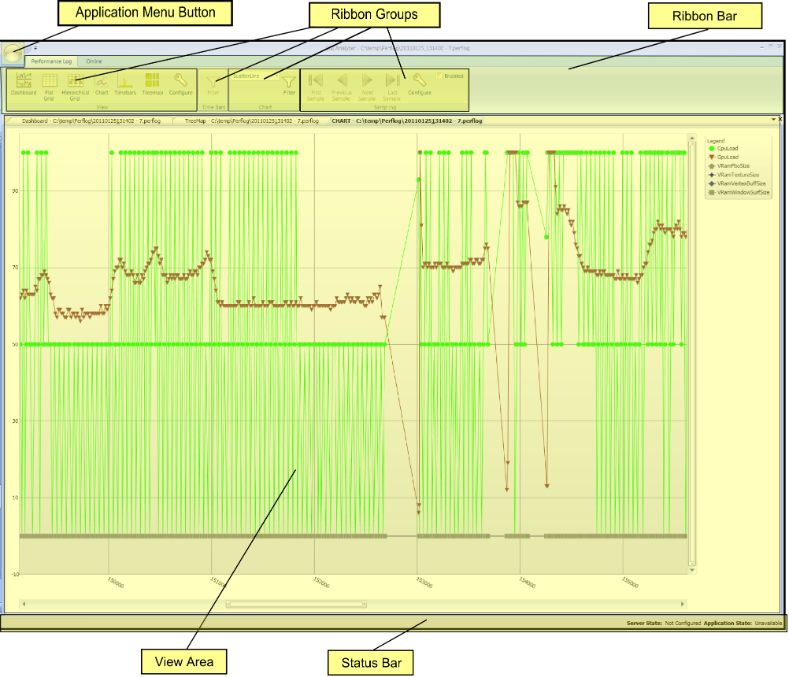
The User Interface is divided in 3 areas:

<div class="contents" id="bkmrk-ribbon-bar-view-area"><div class="contents"><div class="textblock">- Ribbon bar
- View area
- Status bar

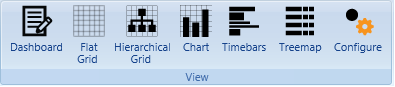
</div></div></div>The ribbon bar is subdivided into groups of controls dedicated to a specific task - ribbon groups. The View Ribbon Group for example allows configuring the display of, opening of, and switching between views.

<div drawio-diagram="1185"><img src="https://doc316en.candera.eu/uploads/images/drawio/2023-02/drawing-4-1676513010.png" alt=""/></div>

<div class="contents" id="bkmrk--1"><div class="contents"><div class="textblock">  
</div></div></div>Analyzer allows Performance Logs to be viewed from different vantage points (views). Each view abstracts from the total amount of data and information to allow the user to easier concentrate on and find the information he searches.

The following views are supported and described in the subsequent sections:

<div class="contents" id="bkmrk-performance-dashboar"><div class="contents"><div class="textblock">- <span style="color: rgb(230, 126, 35);">[Performance Dashboard View:](https://doc316en.candera.eu/link/271#bkmrk-performance-dashboar-0)</span> An overview of key performance indicators
- <span style="color: rgb(230, 126, 35);">[Chart View:](https://doc316en.candera.eu/link/271#bkmrk-chart-view)</span> A view of the trajectories of all value recordings
- <span style="color: rgb(230, 126, 35);">[Time Bars View:](https://doc316en.candera.eu/link/271#bkmrk-time-bars-view)</span> A chronological as well as hierarchical view of all recordings
- <span style="color: rgb(230, 126, 35);">[Grid Views:](https://doc316en.candera.eu/link/271#bkmrk-grid-view)</span> Views in table form   
    &gt; Flat View: A flat view on all recordings   
    &gt; Hierarchical View: A hierarchical (nested) view on all recordings
- <span style="color: rgb(230, 126, 35);">[Treemap View:](https://doc316en.candera.eu/link/271#bkmrk-treemap-view) </span>A nested view of the timing recorders Access to opening and switching between views, as well as configuration of views is provided by the View Ribbon Group.

</div></div></div><div drawio-diagram="1186"><img src="https://doc316en.candera.eu/uploads/images/drawio/2023-02/drawing-4-1676513032.png" alt=""/></div>

<div class="contents" id="bkmrk--3"><div class="textblock">  
</div></div>#### **Application Menu**   


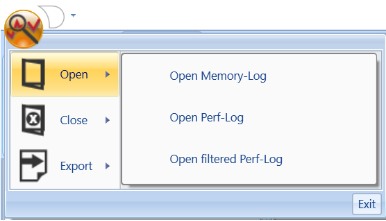
The application menu holds commands for opening and closing a performance log, as well as exporting performance log data.

<div drawio-diagram="5307"><img src="https://doc316en.candera.eu/uploads/images/drawio/2024-02/drawing-5-1708678940.png" alt=""/></div>

<div class="contents" id="bkmrk--6"><div class="textblock">  
</div></div>#### **Configuration**   


The display of performance logs can be configured using the Performance Log Configuration dialog. The dialog can be opened from the "View" Ribbon Group.

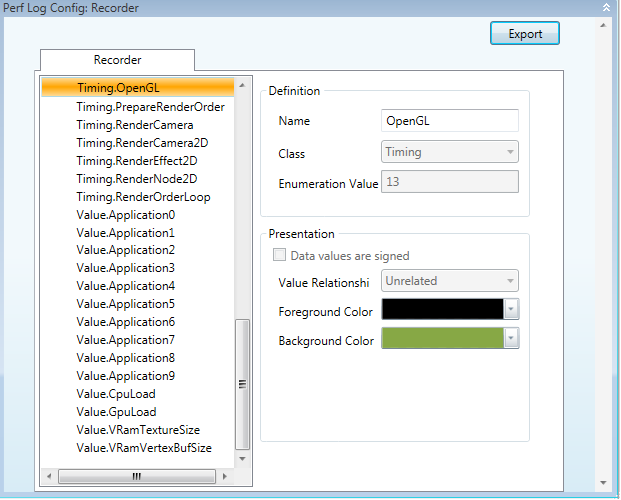
The configuration dialog (depicted in Figure 4) allows the configuration of recording appearances in views as well as how the recordings are interpreted.

On the left side of the dialog, there is a list of all recorder names used. The recorder names displayed are fully qualified, consisting of the recorder class as prefix and the display name of the recorder. On the right side, the properties of the currently selected recorder are displayed and can be changed.

Changeable for all recorders are the following properties:

<div class="contents" id="bkmrk-name%3A-the-name-of-th"><div class="contents"><div class="textblock">- Name: The name of the recorder displayed in all views
- Foreground color: Text color for recordings in Time Bars View
- Background color: Background color for recordings in Time Bars View, Color for trajectory of recordings in Chart View

</div></div></div>Changeable properties for value recorders are:

<div class="contents" id="bkmrk-data-values-are-sign"><div class="contents"><div class="textblock">- Data values are signed: The displayed values are treated as signed values
- Value relationship:   
    &gt; Unrelated: Recorded values are unrelated   
    &gt; Differential: The recorded values are only the difference from the last recorded value, not the total (absolute) value.   
    &gt; Absolute: The values recorded are always equal to the absolute values.

</div></div></div><div drawio-diagram="1188"><img src="https://doc316en.candera.eu/uploads/images/drawio/2023-02/drawing-4-1676514012.png" alt=""/></div>

<div class="contents" id="bkmrk--9"><div class="textblock">  
</div></div>#### **Performance Log Export**   


##### <a class="anchor" id="bkmrk--86"></a>Export of Performance Log

The export of the currently open performance log is available via the application menu.

Currently, exporting of performance log data is supported in the following formats:

<div class="contents" id="bkmrk-microsoft-excel-2007"><div class="contents"><div class="textblock">- Microsoft Excel 2007 (XLSX)
- Comma Separated Values (CSV)

</div></div></div>Since Excel worksheets allow only a limited number of rows, data is distributed over several worksheets. Using this approach, a theoretical total number of 65000x255 rows can be stored in one Excel file. The export of data takes some time, so please be patient.

#### **Sampling**   


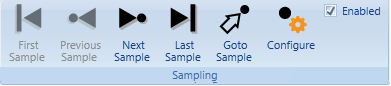
The figure shows the Ribbon Group for sampling. All sampling functionality is available via these controls.

<div drawio-diagram="1189"><img src="https://doc316en.candera.eu/uploads/images/drawio/2023-02/drawing-4-1676514083.png" alt=""/></div>

<div class="contents" id="bkmrk--13"><div class="contents"><div class="textblock">  
</div></div></div>Usage of sampling requires two steps:

<div class="contents" id="bkmrk-configuration-of-sam"><div class="contents"><div class="textblock">- Configuration of sampling for a given view. The sampling configuration dialog can be opened via the "Configure" button.
- Enabling of sampling for the view. Sampling can be enabled via the "enable" checkbox

</div></div></div>Navigation between samples is supported by the navigation buttons in the Sampling Ribbon Group or keyboard shortcuts (see the end of this document for a list).   
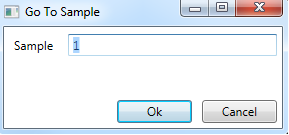
Also, the user can directly jump to a desired sample by pressing the "Goto Sample" button and specifying the desired sample in the provided dialog.

<div drawio-diagram="1190"><img src="https://doc316en.candera.eu/uploads/images/drawio/2023-02/drawing-4-1676514099.png" alt=""/></div>

<div class="contents" id="bkmrk--15"><div class="textblock">  
</div></div>#### **<span style="color: rgb(0, 0, 0);">Measurement Views</span>**


##### **<span style="color: rgb(0, 0, 0);">Performance Dashboard View</span>**

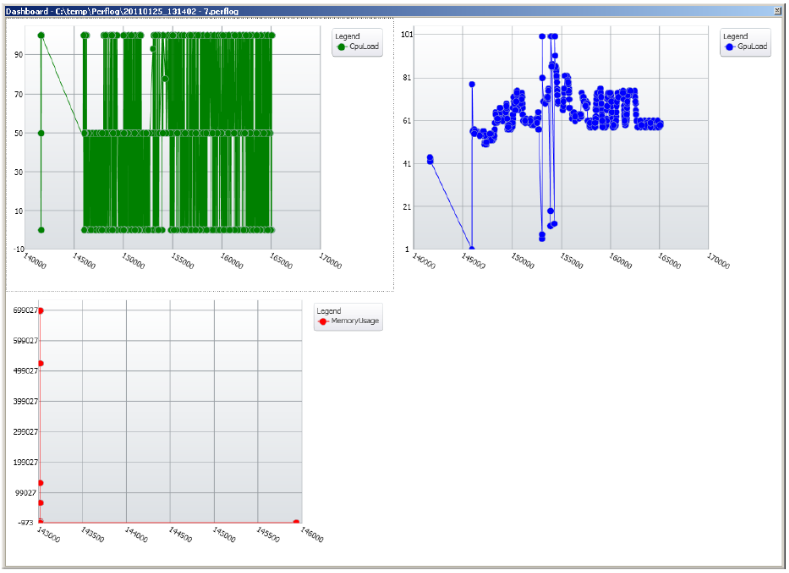
The Performance Dashboard View is the first view, automatically displayed when opening a performance log. It displays recordings of up to four Value Recorders. The actual Value Recorders used here can be customized. After installation, however, CPU load, GPU load and memory allocations are displayed (if available). The figure shows a typical Dashboard View.

<div drawio-diagram="1191"><img src="https://doc316en.candera.eu/uploads/images/drawio/2023-02/drawing-4-1676514715.png" alt=""/></div>

<div class="contents" id="bkmrk--18"><div class="contents"><div class="textblock">  
</div></div></div>For every chart, the x-axis represents the elapsed time and the y-axis a value scale. To the right of each chart, there is a legend for the values displayed in this chart. There are no interactions possible with this view type. Only the values are displayed upon hovering over graphs.

##### <span style="color: rgb(0, 0, 0);">**Chart View**</span>

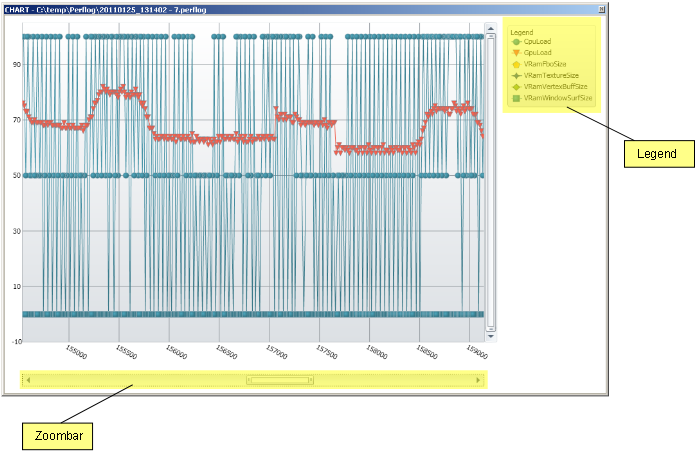
A Chart View, as shown in the figure displays only Value Recordings.

<div drawio-diagram="1192"><img src="https://doc316en.candera.eu/uploads/images/drawio/2023-02/drawing-4-1676514801.png" alt=""/></div>

<div class="contents" id="bkmrk--21"><div class="contents"><div class="textblock">  
</div></div></div>On the x-axis, a time scale is displayed, on the y-axis a common scale for all values. To the right there is a legend for the values currently displayed.

Below the x-axis and to the right of the y-axis, there are so-called zoom bars. They allow the user to zoom-in to as well as pan the chart. Panning is also allowed by left-clicking the chart and dragging it to the left or the right.

By pressing the left shift button, clicking the left mouse button, and dragging the mouse, a part of the chart can be selected for zooming in.

Hovering over a trajectory or a marker displays a tooltip with information about the corresponding value.

<div class="contents" id="bkmrk--22"><div class="contents"><div class="textblock">  
</div></div></div>##### <a class="anchor" id="bkmrk--92"></a>Associated Ribbon Group

<div drawio-diagram="1193"><img src="https://doc316en.candera.eu/uploads/images/drawio/2023-02/drawing-4-1676514818.png" alt=""/></div>

<div class="contents" id="bkmrk--24"><div class="contents"><div class="textblock">  
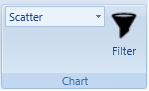
</div></div></div>The Chart Ribbon Group comprises UI elements for configuring the currently active Chart View:

<div class="contents" id="bkmrk-filtering-is-availab"><div class="contents"><div class="textblock">- Filtering is available via the "Filter" button
- Chart interpolation settings are available from the combo box.

</div></div></div>The following interpolations are supported:

<div class="contents" id="bkmrk-scatter%3A-no-interpol"><div class="contents"><div class="textblock">- Scatter: No interpolation is performed; only markers are displayed
- Scatter Line: Simple line interpolation is performed by connection successive markers
- Scatter Spline: Spline interpolation is used.

</div></div></div>##### <a class="anchor" id="bkmrk--94"></a>Filtering

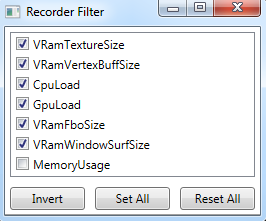
Filtering allows the user to reduce the set of displayed Value Recorders to a desired subset. The shows the recorder filter editor opened via the "Filter" button in the Chart Ribbon Group.

<div drawio-diagram="1194"><img src="https://doc316en.candera.eu/uploads/images/drawio/2023-02/drawing-4-1676514833.png" alt=""/></div>

<div class="contents" id="bkmrk--27"><div class="contents"><div class="textblock">  
</div></div></div>En- and disabling of filters is immediately reflected in the chart.

<div class="contents" id="bkmrk-%22invert%22-inverts-the"><div class="contents"><div class="textblock">- "Invert" inverts the current selection of recorders,
- "Set All" enables all recorders,
- "Reset All" disables all recorders in the current Chart View.

</div></div></div>##### Sampling

Sampling is available via the Sampling Ribbon Group. See section "Filtering" on page <span style="color: rgb(230, 126, 35);">[Views - Filtering - Sampling](https://doc316en.candera.eu/link/268#bkmrk-views---filtering---)</span> for details.

##### **<span style="color: rgb(0, 0, 0);">Grid View</span>**

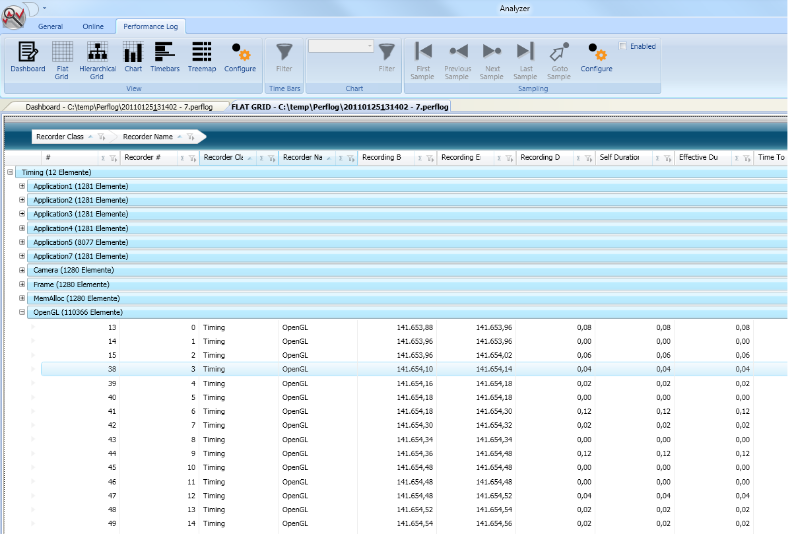
Flat and Hierarchical Grid Views allow display of all recordings in a grid similar to Microsoft Excel. Table 1 lists and explains the displayed columns.

##### <a class="anchor" id="bkmrk--98"></a>Grid View Columns

<div class="contents" id="bkmrk-column-header-title-"><div class="contents"><div class="textblock"><table border="1" cellpadding="5" cellspacing="0" style="border-collapse: collapse; width: 800px; border-width: 1px; border-spacing: 0px;" width="900"><tbody><tr bgcolor="#d4d4d4"><th style="border-width: 1px; padding: 5px;" width="25%">**Column Header**</th><th style="border-width: 1px; padding: 5px;" width="75%">**Title Description**</th></tr><tr><td style="border-width: 1px; padding: 5px;">\#</td><td style="border-width: 1px; padding: 5px;">Sequence number of the recording. Numbering starts at zero.</td></tr><tr><td style="border-width: 1px; padding: 5px;">Recorder #</td><td style="border-width: 1px; padding: 5px;">Sequence number of the recorder. This is the number of the recorder in the sequence of recorders with same class and name. Numbering starts at zero.</td></tr><tr><td style="border-width: 1px; padding: 5px;">Recorder Class</td><td style="border-width: 1px; padding: 5px;">The class of the recorder. See section 4.1.1 for a list of available recorder classes.</td></tr><tr><td style="border-width: 1px; padding: 5px;">Recorder Name</td><td style="border-width: 1px; padding: 5px;">The unique name of the recorder within its class</td></tr><tr><td style="border-width: 1px; padding: 5px;">Recording Begin</td><td style="border-width: 1px; padding: 5px;">The time, this recording started. Unit is milliseconds.</td></tr><tr><td style="border-width: 1px; padding: 5px;">Recording End</td><td style="border-width: 1px; padding: 5px;">The time, this recording ended. Unit is milliseconds.</td></tr><tr><td style="border-width: 1px; padding: 5px;">Recording Duration</td><td style="border-width: 1px; padding: 5px;">The difference between Recording Begin and Recording End. Unit is milliseconds.</td></tr><tr><td style="border-width: 1px; padding: 5px;">Self Duration</td><td style="border-width: 1px; padding: 5px;">The amount of time, this recording contributed to the recorded duration (if nested). Unit is milliseconds.</td></tr><tr><td style="border-width: 1px; padding: 5px;">Effective Duration</td><td style="border-width: 1px; padding: 5px;">Depending on the recorder class, the effective duration yields the following:

- Cumulative Timing Recording: The accumulated duration
- Asynchronous Timing Recording: The asynchronous duration
- Other recorder classes: The self duration

Unit is milliseconds.

</td></tr><tr><td style="border-width: 1px; padding: 5px;">Time To Next Recording</td><td style="border-width: 1px; padding: 5px;">Unit is milliseconds.</td></tr><tr><td style="border-width: 1px; padding: 5px;">Annotation</td><td style="border-width: 1px; padding: 5px;">A string enabling further differentiation between Recordings with same class and same name. The OpenGL timing recorder uses annotations e.g. to differentiate between calls of different functions.</td></tr><tr><td style="border-width: 1px; padding: 5px;">Call Count</td><td style="border-width: 1px; padding: 5px;">Depending on the recorder class, the call count yields the following: - Cumulative Timing Recorder: The number of recordings of this recorder
- Cumulative Value Recorder: The number of recordings of this recorder
- Other recorder classes: No value

</td></tr><tr><td style="border-width: 1px; padding: 5px;">Value</td><td style="border-width: 1px; padding: 5px;">Depending on the recorder class, the value yields the following: - Value Recorder The value
- Otherwise no value

</td></tr><tr><td style="border-width: 1px; padding: 5px;">Absolute Value</td><td style="border-width: 1px; padding: 5px;">Depending on the recorder class, the absolute value yields the following: - Cumulative Value Recorder The absolute (up until then cumulated) value
- Other recorder classes no value

</td></tr></tbody></table>

</div></div></div>##### <a class="anchor" id="bkmrk--99"></a>Filtering

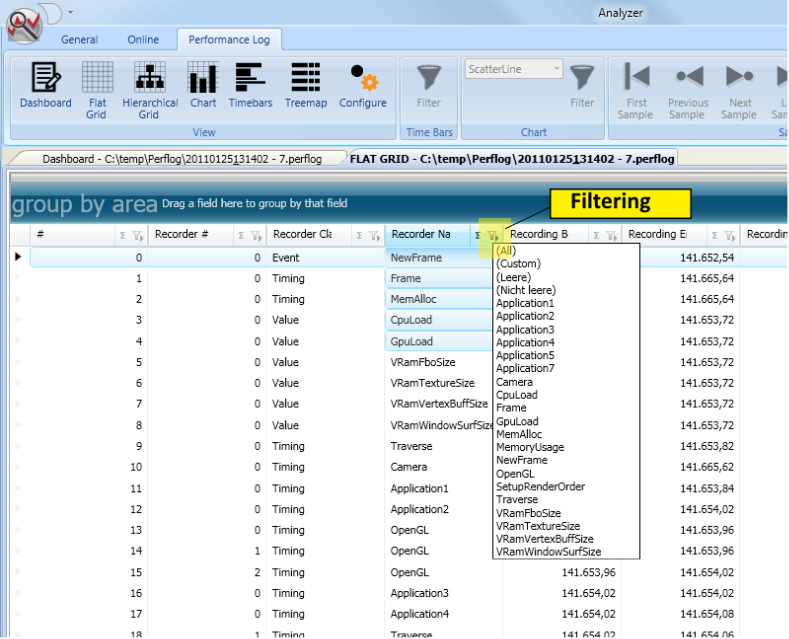
Filtering in the grid views is available via the grid column headers as depicted in Figure 11. The filtering options are:

<div drawio-diagram="1195"><img src="https://doc316en.candera.eu/uploads/images/drawio/2023-02/drawing-4-1676514987.png" alt=""/></div>

<div class="contents" id="bkmrk--32"><div class="contents"><div class="textblock">  
</div></div></div>##### <a class="anchor" id="bkmrk--101"></a>Grid Filtering Options

<div class="contents" id="bkmrk-filter-option-descri"><div class="contents"><div class="textblock"><table border="1" cellpadding="5" cellspacing="0" style="border-collapse: collapse; width: 800px; border-width: 1px; border-spacing: 0px;" width="900"><tbody><tr bgcolor="#d4d4d4"><th style="border-width: 1px; padding: 5px;" width="20%">**Filter Option**</th><th style="border-width: 1px; padding: 5px;" width="65%">**Description**</th><th style="border-width: 1px; padding: 5px;" width="15%">**Only Numeric**</th></tr><tr><td style="border-width: 1px; padding: 5px;">All</td><td style="border-width: 1px; padding: 5px;">Displays all recordings</td><td style="border-width: 1px; padding: 5px;">No</td></tr><tr><td style="border-width: 1px; padding: 5px;">Custom</td><td style="border-width: 1px; padding: 5px;">Displays a dialog for constructing a custom filter expression</td><td style="border-width: 1px; padding: 5px;">No</td></tr><tr><td style="border-width: 1px; padding: 5px;">Empty</td><td style="border-width: 1px; padding: 5px;">Display all recordings that contain no value in this column</td><td style="border-width: 1px; padding: 5px;">No</td></tr><tr><td style="border-width: 1px; padding: 5px;">Not Empty</td><td style="border-width: 1px; padding: 5px;">Display all recordings that contain a value</td><td style="border-width: 1px; padding: 5px;">No</td></tr><tr><td style="border-width: 1px; padding: 5px;">Below Average</td><td style="border-width: 1px; padding: 5px;">All recordings that have values below average in this column</td><td style="border-width: 1px; padding: 5px;">Yes</td></tr><tr><td style="border-width: 1px; padding: 5px;">Above Average</td><td style="border-width: 1px; padding: 5px;">All recordings that have values above average in this column</td><td style="border-width: 1px; padding: 5px;">Yes</td></tr><tr><td style="border-width: 1px; padding: 5px;">Lower 10</td><td style="border-width: 1px; padding: 5px;">The 10 lowest values in this column</td><td style="border-width: 1px; padding: 5px;">Yes</td></tr><tr><td style="border-width: 1px; padding: 5px;">Upper 10</td><td style="border-width: 1px; padding: 5px;">The ten highest values in this column</td><td style="border-width: 1px; padding: 5px;">Yes</td></tr><tr><td style="border-width: 1px; padding: 5px;">Lower 10-Quantile</td><td style="border-width: 1px; padding: 5px;">In descriptive statistics, a 10-quantile (also known as decile) is any of the nine values that divide the sorted data into ten equal parts, so that each part represents 1/10 of the sample or population.   
Thus, the lower 10-Quantile is the 1st decile and contains the lowest 10% of data, i.e. the 10th percentile.</td><td style="border-width: 1px; padding: 5px;">Yes</td></tr><tr><td style="border-width: 1px; padding: 5px;">Upper 10-Quantile</td><td style="border-width: 1px; padding: 5px;">The upper 10-Quantile is the 10th decile and contains the highest 10% of data.</td><td style="border-width: 1px; padding: 5px;">Yes</td></tr></tbody></table>

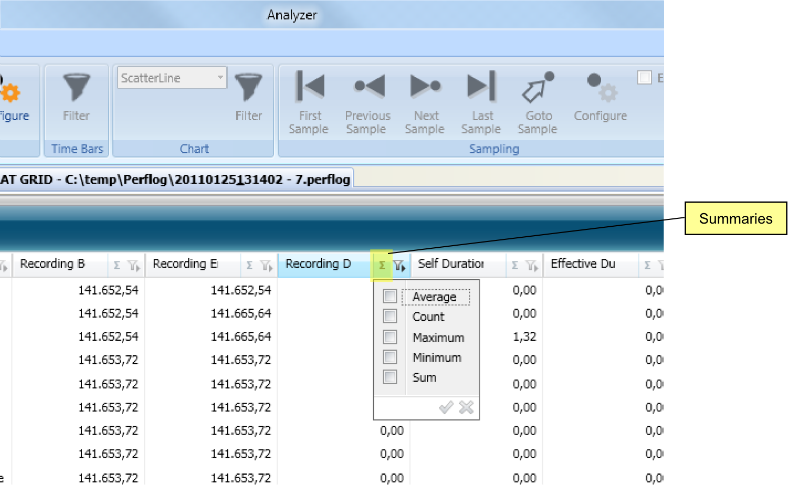
</div></div></div><div class="contents" id="bkmrk-summaries"><div class="contents"><div class="textblock"><a class="anchor" id="bkmrk--102" style="font-size: 1.4em; font-weight: 400; background-color: rgb(255, 255, 255);"></a><span style="color: rgb(34, 34, 34); font-size: 1.4em; font-weight: 400;">Summaries</span></div></div></div>Summaries are small evaluations over values in one column. Summaries can be en- and disabled via the grid column headers.

<div drawio-diagram="1196"><img src="https://doc316en.candera.eu/uploads/images/drawio/2023-02/drawing-4-1676515039.png" alt=""/></div>

<div class="contents" id="bkmrk--36"><div class="contents"><div class="textblock">  
</div></div></div>##### <a class="anchor" id="bkmrk--104"></a>Grid View Summary Options

<div class="contents" id="bkmrk-summary-option-descr"><div class="contents"><div class="textblock"><table border="1" cellpadding="5" cellspacing="0" style="border-collapse: collapse; width: 800px; border-width: 1px; border-spacing: 0px;" width="900"><tbody><tr bgcolor="#d4d4d4"><th style="border-width: 1px; padding: 5px;" width="20%">**Summary Option**</th><th style="border-width: 1px; padding: 5px;" width="65%">**Description**</th><th style="border-width: 1px; padding: 5px;" width="15%">**Only Numeric**</th></tr><tr><td style="border-width: 1px; padding: 5px;">Count</td><td style="border-width: 1px; padding: 5px;">Number of rows displayed</td><td style="border-width: 1px; padding: 5px;">No</td></tr><tr><td style="border-width: 1px; padding: 5px;">Average</td><td style="border-width: 1px; padding: 5px;">The average over all displayed values</td><td style="border-width: 1px; padding: 5px;">Yes</td></tr><tr><td style="border-width: 1px; padding: 5px;">Maximum</td><td style="border-width: 1px; padding: 5px;">The highest value</td><td style="border-width: 1px; padding: 5px;">No</td></tr><tr><td style="border-width: 1px; padding: 5px;">Minimum</td><td style="border-width: 1px; padding: 5px;">The lowest value</td><td style="border-width: 1px; padding: 5px;">No</td></tr><tr><td style="border-width: 1px; padding: 5px;">Sum</td><td style="border-width: 1px; padding: 5px;">The sum over all values</td><td style="border-width: 1px; padding: 5px;">Yes</td></tr></tbody></table>

</div></div></div>##### <a class="anchor" id="bkmrk--105"></a>Grouping

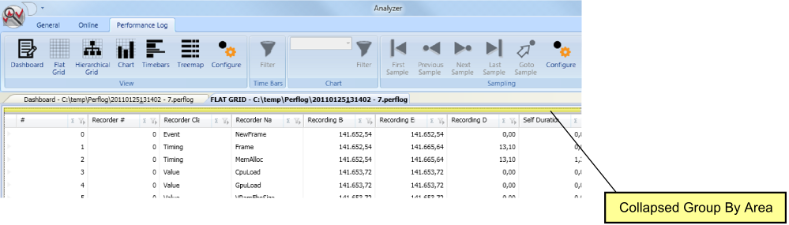
A grouping is a planned arrangement of all recordings by values in one column. Using this feature, it is possible to impose a hierarchical structure on the recordings. Grouping is accomplished by dragging a column header to the group-by-area. By default the group by area is collapsed.

<div drawio-diagram="1197"><img src="https://doc316en.candera.eu/uploads/images/drawio/2023-02/drawing-4-1676515075.png" alt=""/></div>

<div class="contents" id="bkmrk--39"><div class="contents"><div class="textblock">  
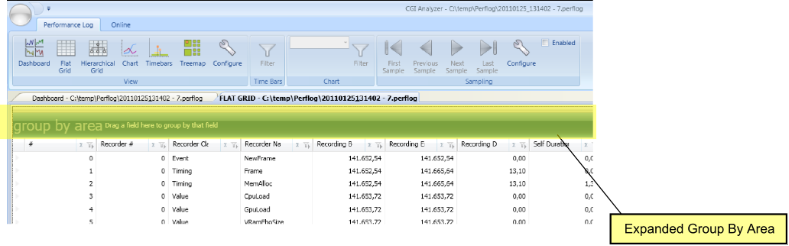
</div></div></div>In order to restore the group by area, left-click on it or drag a column header and drop in on the collapsed group by area.

<div drawio-diagram="1198"><img src="https://doc316en.candera.eu/uploads/images/drawio/2023-02/drawing-4-1676515112.png" alt=""/></div>

<div class="contents" id="bkmrk--41"><div class="contents"><div class="textblock">  
</div></div></div>Groupings can be chained, i.e. the recordings can first be grouped by values of one column, than by values of another column, and so on. The next figure shows recordings first grouped by recorder class and then by recorder name in order to collect all OpenGL recorders in one group.

<div drawio-diagram="1199"><img src="https://doc316en.candera.eu/uploads/images/drawio/2023-02/drawing-4-1676515132.png" alt=""/></div>

<div class="contents" id="bkmrk--43"><div class="textblock">  
</div></div>##### <span style="color: rgb(0, 0, 0);">**Time Bars View**</span>

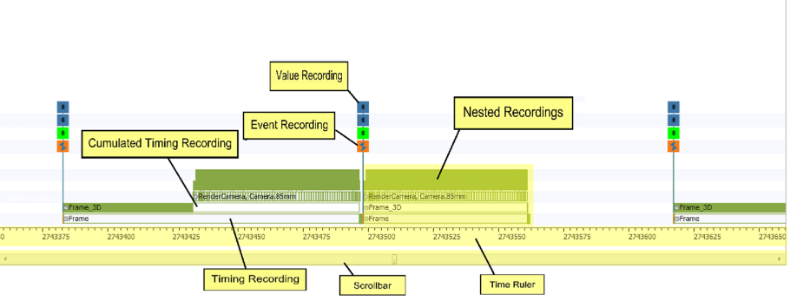
Time Bars View displays all recordings arranged along a timeline. Below the actual time bars, there is a scrollbar for panning the displayed time frame. The time ruler is situated between time bars and the scrollbar. Here, time values in milliseconds and a cursor with the current time under the mouse pointer are displayed.

These icons are used to distinguish the different recorder classes:

<div class="contents" id="bkmrk-time-recording-value"><div class="contents"><div class="textblock"><table border="0" cellspacing="10" style="width: 40.3704%; height: 237.969px;"><tbody><tr style="height: 83.1875px;" valign="middle"><td style="width: 20.7951%; height: 83.1875px;">[![measurement_timebar-icon_1.PNG](https://doc316en.candera.eu/uploads/images/gallery/2023-02/scaled-1680-/measurement-timebar-icon-1.PNG)](https://doc316en.candera.eu/uploads/images/gallery/2023-02/measurement-timebar-icon-1.PNG)

<div class="image">  
</div></td><td style="width: 78.8847%; height: 83.1875px;">Time Recording</td></tr><tr style="height: 66.3906px;" valign="middle"><td style="width: 20.7951%; height: 66.3906px;">[![measurement_timebar-icon_2.PNG](https://doc316en.candera.eu/uploads/images/gallery/2023-02/scaled-1680-/measurement-timebar-icon-2.PNG)](https://doc316en.candera.eu/uploads/images/gallery/2023-02/measurement-timebar-icon-2.PNG)

</td><td style="width: 78.8847%; height: 66.3906px;">Value Recording</td></tr><tr style="height: 28.7969px;" valign="middle"><td style="width: 20.7951%; height: 28.7969px;">[![measurement_timebar-icon_3.PNG](https://doc316en.candera.eu/uploads/images/gallery/2023-02/scaled-1680-/measurement-timebar-icon-3.PNG)](https://doc316en.candera.eu/uploads/images/gallery/2023-02/measurement-timebar-icon-3.PNG)

</td><td style="width: 78.8847%; height: 28.7969px;">Event Recording</td></tr><tr style="height: 29.7969px;" valign="middle"><td style="width: 20.7951%; height: 29.7969px;">[![measurement_timebar-icon_4.PNG](https://doc316en.candera.eu/uploads/images/gallery/2023-02/scaled-1680-/measurement-timebar-icon-4.PNG)](https://doc316en.candera.eu/uploads/images/gallery/2023-02/measurement-timebar-icon-4.PNG)

</td><td style="width: 78.8847%; height: 29.7969px;">Asynchronous Recording</td></tr><tr style="height: 29.7969px;" valign="middle"><td style="width: 20.7951%; height: 29.7969px;">[![measurement_timebar-icon_5.PNG](https://doc316en.candera.eu/uploads/images/gallery/2023-02/scaled-1680-/measurement-timebar-icon-5.PNG)](https://doc316en.candera.eu/uploads/images/gallery/2023-02/measurement-timebar-icon-5.PNG)

</td><td style="width: 78.8847%; height: 29.7969px;">Cumulative Recording (timing or value)</td></tr></tbody></table>

</div></div></div><div drawio-diagram="1208"><img src="https://doc316en.candera.eu/uploads/images/drawio/2023-02/drawing-4-1676515293.png" alt=""/></div>

<div class="contents" id="bkmrk--47"><div class="contents"><div class="textblock">  
</div></div></div>##### <a class="anchor" id="bkmrk--110"></a>Associated Ribbon Group

The next figure shows the ribbon group associated with the Time Bars View. It contains only one button for displaying the recorder filtering dialog.

<div drawio-diagram="1209"><img src="https://doc316en.candera.eu/uploads/images/drawio/2023-02/drawing-4-1676515305.png" alt=""/></div>

<div class="contents" id="bkmrk--50"><div class="contents">  
</div></div>##### <a class="anchor" id="bkmrk--112"></a>Filtering, 

Filtering here works analogous to filtering in the Chart View. Via the "Filter" button on the associated ribbon group the filter editor dialog is opened. En- and disabling of filters is immediately reflected in the chart.

<div class="contents" id="bkmrk-%22invert%22-inverts-the-0"><div class="contents"><div class="textblock">- "Invert" inverts the current selection of recorders,
- "Set All" enables all recorders,
- "Reset All" disables all recorders in the current Chart View.

</div></div></div>##### Sampling

Sampling is not supported for the Time Bars View.

##### **Zooming**

<div class="contents" id="bkmrk-zooming-is-supported"><div class="contents"><div class="textblock">Zooming is supported via two mechanisms:  
</div></div></div><div class="contents" id="bkmrk-mouse-wheel-keyboard"><div class="contents"><div class="textblock">- Mouse wheel
- Keyboard shortcuts

</div></div></div>Point the mouse pointer to the time you wish to zoom into. By using the mouse wheel or pressing Ctrl and the "+" or "-" button, you can zoom in to or out of this point in time. See section <span style="color: rgb(230, 126, 35);">[Keyboard Shortcuts](https://doc316en.candera.eu/link/261#bkmrk-page-title)</span> for a list of all available keyboard shortcuts.

##### <span style="color: rgb(0, 0, 0);">**Treemap View**</span>

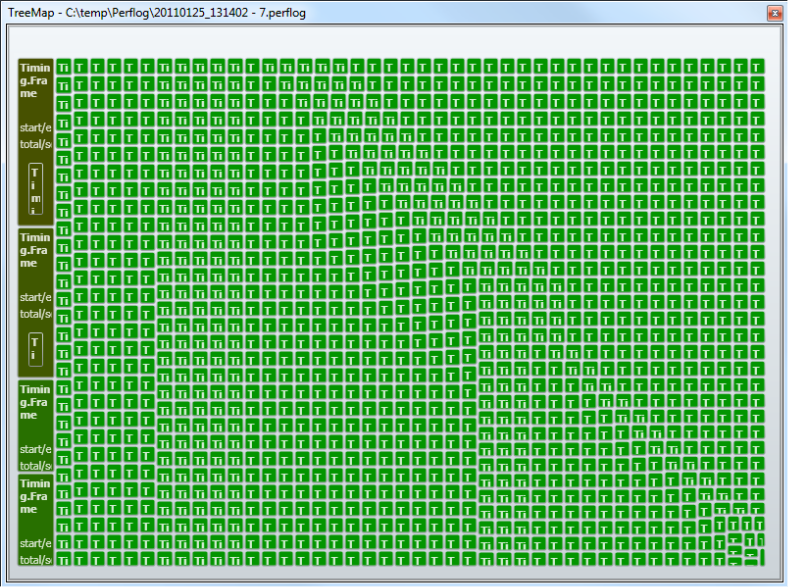
The Treemap View only displays timing recordings along with their nesting. The following figure depicts the Treemap View of a performance log.

<div drawio-diagram="1210"><img src="https://doc316en.candera.eu/uploads/images/drawio/2023-02/drawing-4-1676515425.png" alt=""/></div>

<div class="contents" id="bkmrk--56"><div class="contents"><div class="textblock">  
</div></div></div>This view shows all timing recordings ordered by decreasing recording duration. The timing recording with the highest performance impact on one nesting level is drawn in the upper left corner, the recording with the lowest impact in the lower right corner.

Left-clicking an item in the treemap drills into this item. Right-clicking an item returns to its parent.

##### <a class="anchor" id="bkmrk--116"></a>Filtering

Filtering is not available for the Treemap View.

##### <a class="anchor" id="bkmrk--117"></a>Sampling

Sampling is available via the Sampling Ribbon Group.