# Data presentation

#### **Term definitions** 

<div class="contents" id="bkmrk-node%3A-a-node-is-defi"><div class="textblock">- Node: A node is defined as an instance of MemoryPool such as a block, a bin, a MemoryPool and the program itself.
- Event: An event represents a happening which were recorded. Events can be all types of allocations and frees.
- System: One complete log including all events and nodes.
- Requested Size: Requested size defines the size a user tried to allocate.
- Used Size: Used size defines the size which was actually allocated by the MemoryPools.
- Total Size: Total size is the current size of a node within the backing heap.
- Delta: It is possible that memory changes can happen in a not measurable time depending on the time resolution. A delta is an additional indicator to order calls within the same timestamp.

</div></div><div class="contents" id="bkmrk-all-sizes-do-not-con"><div class="textblock"><dl class="note"><dd><p class="callout info">All sizes do NOT contain the overhead of header information. The sizes always refer to the actual buffer size which can be used by the application.</p>

</dd></dl></div></div>#### **How to select data** 

##### <a class="anchor" id="bkmrk--14"></a>Memory Pool Explorer

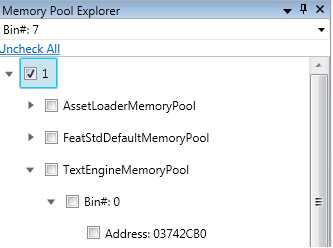
The Memory Pool Explorer is used to restrict certain views to a specific dataset. It filters nodewise.  
In many usecases the knowledge about a specific node is important.  
For example:

<div class="contents" id="bkmrk-how-much-memory-were"><div class="contents"><div class="textblock">- How much memory were allocated in total?
- How much memory were allocated per MemoryPool?
- What is the proportion between these two?
- What is the difference between two systems?
- ... The Memory Pool Explorer is the primary way to indicate which nodes have to be compared.

</div></div></div>The hierarchy of the explorer is:

<div class="contents" id="bkmrk-systems-memorypools-"><div class="contents"><div class="textblock">- Systems 
    - MemoryPools 
        - Bins 
            - Blocks

</div></div></div>In most cases Systems and MemoryPools are enough to give a rough understanding how two nodes do relate.  
However, sometimes it is also important to understand how specific bins or even blocks (addresses) are used.  
Therefore all available nodes can be selected individually.   
Searching for a specific address can be quite troublesome, so a search bar for nodes exists to make the finding process easier.

<div drawio-diagram="1273"><img src="https://doc316en.candera.eu/uploads/images/drawio/2023-02/drawing-4-1676526654.png" alt=""/></div>

<div class="contents" id="bkmrk--0"><div class="contents"><div class="textblock">  
</div></div></div>##### <a class="anchor" id="bkmrk--16"></a>Global Time Slider

The Global Time Slider provides a slider with integrated zoom bar. The slider defines the current system time of which you may want to get further information.  
To go to the first occurring time or the very last entry within the trace, you may click on one of the two buttons at left and right side of slider.

At some time it is important to have a memory snapshot at a given time. The slider is used to select the required time.

<div drawio-diagram="1274"><img src="https://doc316en.candera.eu/uploads/images/drawio/2023-02/drawing-4-1676526683.png" alt=""/></div>

#### **Memory Properties** 

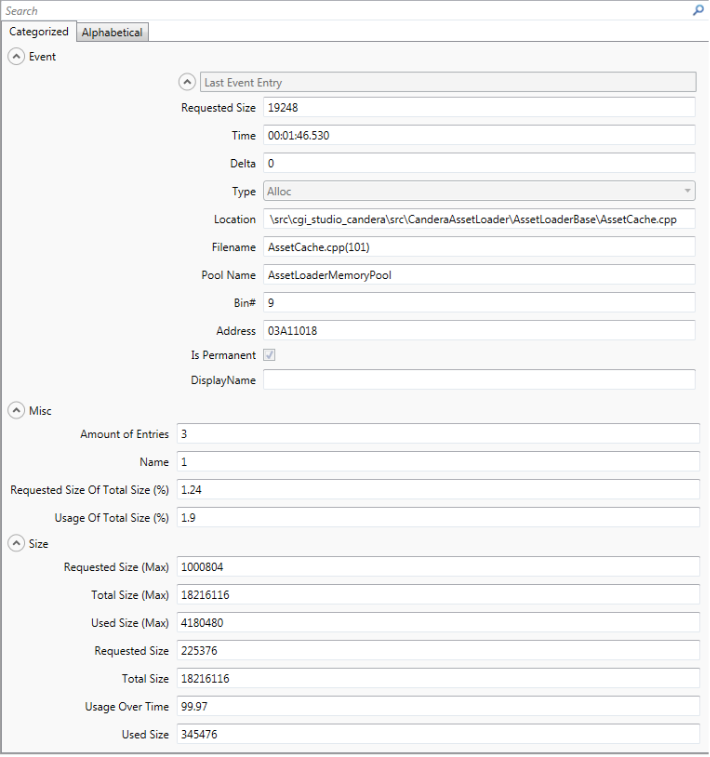
The memory pool properties view gives a short overview of currently selected nodes.  
The reference time for any information provided by the property list is based on the global time slider and its time value.

The properties are divided into three categories:

<div class="contents" id="bkmrk-event%3A-shows-the-ver"><div class="contents"><div class="textblock">- Event: Shows the very last event happened to the selected node(s) and its detailed information.
- Misc: Gives a brief overview of current selected nodes and statistics.
- Size: Shows information about the three size values: requested size, used size and total size. Additionally, information about the maximum up until the set global time of each size is given.

</div></div></div><div drawio-diagram="1275"><img src="https://doc316en.candera.eu/uploads/images/drawio/2023-02/drawing-4-1676526721.png" alt=""/></div>

<div class="contents" id="bkmrk--4"></div>#### **Memory Pool Statistics** 

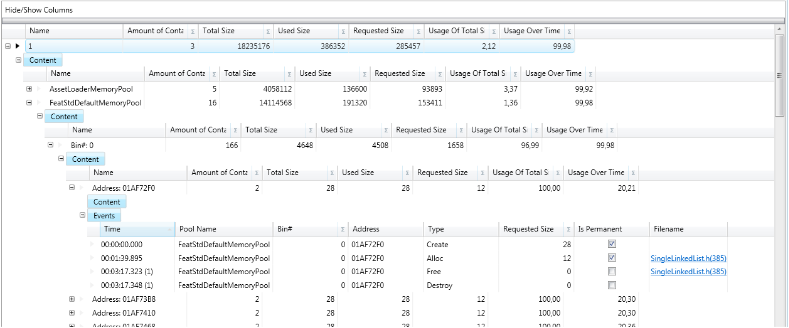
The memory pool statistics gives a detailed information about all events occurred on the selected nodes and sub nodes. Additionally the current size related values are shown.

Each node contains two different types of table: A content table and an event table.

The content table gives information about:

<div class="contents" id="bkmrk-name-of-node-amount-"><div class="contents"><div class="textblock">- Name of node
- Amount of container: How many nodes does this container have?
- Total size
- Used size
- requested size
- usage of total size: How much size is in use compared to total size in percentage
- usage over time: how long is a node or one of his sub nodes in use compared to total length of time.
- Maximum of requested size until global time selected by slider.
- Maximum of used size until global time selected by slider.
- Maximum of total size until global time selected by slider.

</div></div></div>The event table gives information about:

<div class="contents" id="bkmrk-the-time-when-an-eve"><div class="contents"><div class="textblock">- The time when an event occurs
- The delta time of event. Sometimes more than one event occurs at the same time. To create a chronological order a second time is base is created. The second time base is called delta.
- Pool name in which the event occurs.
- Bin number in which the event occurs.
- Address of block which raises the event.
- Type of event.
- Requested size: A creation sets the block size which was created; an allocation sets size of user request. Otherwise its 0.
- Permanent: Permanent flag of creation or allocation. Destructions and frees do not have this flag, so it’s always not set.
- Filename: Shows location where event occurred. Creations and destructions do not have a location. Clicking on a filename opens the specific file in a file editor.

</div></div></div><div drawio-diagram="1276"><img src="https://doc316en.candera.eu/uploads/images/drawio/2023-02/drawing-4-1676526754.png" alt=""/></div>

<div class="contents" id="bkmrk--6"></div>#### **Memory Bar Charts**

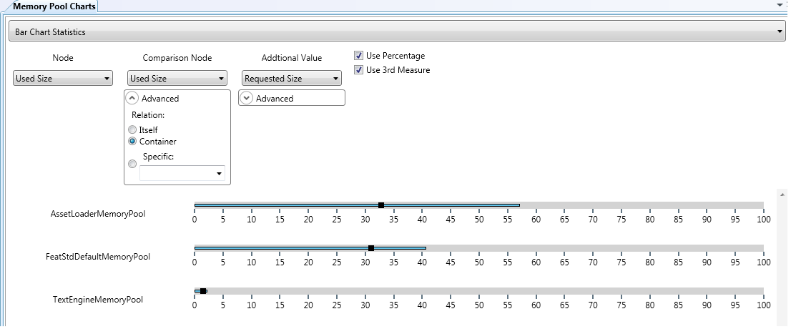
Accessing the Memory Bar Charts is done by clicking on Memory Pool Charts on the Analyzer ribbon tab and selecting 'Bar Chart Statistics' on the drop down menu.

The Memory Bar Charts are used to directly compare different nodes at a specified time.

There are a total of three different values which can be shown within a single bar chart simultaneously. Any value can be set independent from the others.  
The first value always refers to a selected node. The others can show information of the selected node, Information of the node which contains the selected node or a specific reference to a node. When last option is chosen every selected node has the specified node as second reference.

Current comparison values are:

<div class="contents" id="bkmrk-used-size-requested-"><div class="contents"><div class="textblock">- Used Size
- Requested size
- Total Size
- Usage over time
- Maximum of requested size
- Maximum of used size
- Maximum of total size

</div></div></div>The third comparison value is activated when the checkbox is checked.  
Another option is to toggle the percentage mode. When this mode is active, relationship between node's value and its comparison value is shown in percentage.

<div drawio-diagram="1277"><img src="https://doc316en.candera.eu/uploads/images/drawio/2023-02/drawing-4-1676526788.png" alt=""/></div>

<div class="contents" id="bkmrk--9"></div>####   
**Memory Over Time Chart** 

Accessing the Memory Over Time Charts is done by clicking on Memory Pool Charts on the Analyzer ribbon tab and selecting 'Bar Chart Statistics' on the drop down menu.

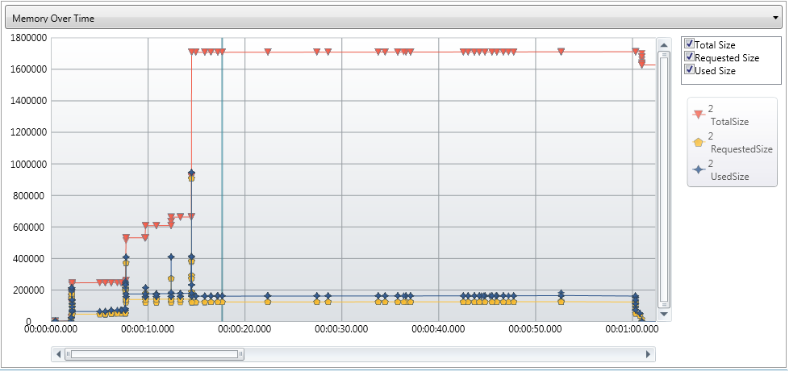
This chart gives a visual overview of the memory behavior over time. All selected nodes are shown within this chart. Every selected node provides three different lines within this chart:

<div class="contents" id="bkmrk-requested-size-used-"><div class="contents"><div class="textblock">- Requested size
- Used size
- Total size

</div></div></div>All three of them can be disabled to concentrate on the currently most important graph. Within this chart is a vertical line which marks the time value selected by the slider.

<div drawio-diagram="1278"><img src="https://doc316en.candera.eu/uploads/images/drawio/2023-02/drawing-4-1676526816.png" alt=""/></div>

<div class="contents" id="bkmrk--11"></div>#### **Information list**   


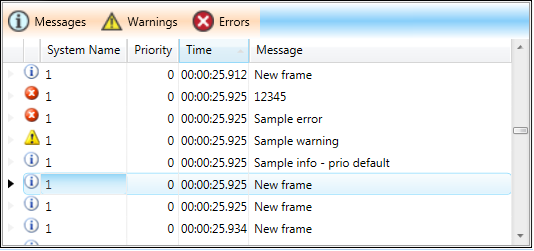
The info list lists all occurred notification events. A notification event can be an info message, warning or error.

There are three types of info messages:

<div class="contents" id="bkmrk-start-key-message%3A-s"><div class="contents"><div class="textblock">- Start key message: Sets a start point
- End key message: Sets an endpoint
- Information message
</div></div></div>A start key and its corresponding end key, both have to have the same name, are forming a group. An information message may have a priority level. The default priority is set to 0. All three types can be toggled on or off.

<div class="contents" id="bkmrk-see-also%3A-informatio"><div class="contents"><div class="textblock"><dl class="see"><dt>**See also:**</dt><dd><span style="color: rgb(230, 126, 35);">[Informational data](https://doc316en.candera.eu/link/282#bkmrk-informational-data)</span></dd></dl></div></div></div><div drawio-diagram="1279"><img src="https://doc316en.candera.eu/uploads/images/drawio/2023-02/drawing-4-1676526852.png" alt=""/></div>