# Analyzer

Analyzer is an application which provides several measurement and analysis tools. These tools can be used in connection to CGI Studio projects. Some of these tools are SDI (single document interface) tools. Therefore, these tools can open one analysis file at a time. However, an arbitrary number of Analyzer instances can be open at any time. Opening several instances uses a single base of settings. This may lead to overriding settings when saving or closing an instance.

# General Information

# Introduction

#### <a class="anchor" id="bkmrk-"></a>Introduction

We are working in the 2D and 3D domain on embedded devices which continuously strains all given resources. Real-time operations, lack of resources, quality, production cost and time constraints are typical challenges fought every day. It is a major concern to meet all these constraints, so tools are needed to help fulfill such constraints. Analyzer is one such tool trying to fill the gap and support developers in several performance and resource issues to deliver high quality on time.

Analyzer support comprises two components, one on the target device side and one on the PC side. Measurement Logs may be recorded on the target or device simulation on the PC. These measurements have then to be transferred to the PC and can be displayed and analyzed in Analyzer.

# Prerequisites

#### <a class="anchor" id="bkmrk-"></a>Prerequisites

<div class="contents" id="bkmrk-operating-system%3A-wi"><div class="contents"><div class="textblock">- Operating System: Windows Vista or higher
- .NET Runtime 4.5.2 or higher

</div></div></div>#### <a class="anchor" id="bkmrk--0"></a>Installation

Analyzer does not require an installation. The Analyzer files including the executable "Analyzer.exe" are located in the subfolder "bin/Analyzer" of the delivered package. Performance Log Configuration file is in the same directory within the subfolder "Templates":

<div class="contents" id="bkmrk-perfdataconfig.xml-%28"><div class="textblock">- PerfDataConfig.xml (Configuration file for display of performance logs.)

</div></div><div class="contents" id="bkmrk-the-file-perfdatacon"><div class="textblock"><dl class="note"><dd><p class="callout info">The file PerfDataConfig.xml has to reside in the same directory as the performance log files to open!</p>

</dd></dl></div></div>

# Keyboard Shortcuts

#### <a class="anchor" id="bkmrk-"></a>Keyboard Shortcuts

<div class="contents" id="bkmrk-shortcut-description"><div class="textblock"><table border="1" cellpadding="5" cellspacing="0" width="800"><tbody><tr bgcolor="#d4d4d4"><th width="25%">**Shortcut**</th><th width="75%">**Description**</th></tr><tr><td>Ctrl + C</td><td>Show Chart View</td></tr><tr><td>Ctrl + D</td><td>Show Dashboard View</td></tr><tr><td>Ctrl + F</td><td>Show Flat Grid View</td></tr><tr><td>Ctrl + G</td><td>Go to sample</td></tr><tr><td>Ctrl + H</td><td>Show Hierarchical Grid View</td></tr><tr><td>Ctrl + O</td><td>Open a performance log</td></tr><tr><td>Ctrl + M</td><td>Show Treemap View</td></tr><tr><td>Ctrl + T</td><td>Show Time Bars View</td></tr><tr><td>Ctrl + Home</td><td>First Sample</td></tr><tr><td>Ctrl + PageUp</td><td>Previous Sample</td></tr><tr><td>Ctrl + PageDown</td><td>Next Sample</td></tr><tr><td>Ctrl + End</td><td>Last Sample</td></tr><tr><td>Ctrl + "+"</td><td>Zoom-in to Time Bars View at mouse pointer position</td></tr><tr><td>Ctrl + "-"</td><td>Zoom-out of Time Bars View at mouse pointer position</td></tr><tr><td>Mouse Wheel Up</td><td>Zoom-in to Time Bars View at mouse pointer position</td></tr><tr><td>Mouse Wheel Down</td><td>Zoom-out of Time Bars View at mouse pointer position</td></tr><tr><td>F5</td><td>Continue Application</td></tr><tr><td>F6</td><td>Pause Application</td></tr></tbody></table>

</div></div>

# GUI Shell Overview

# Menu

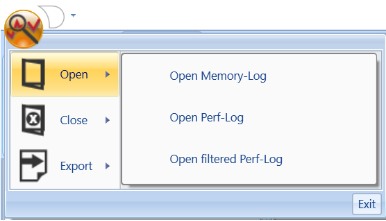
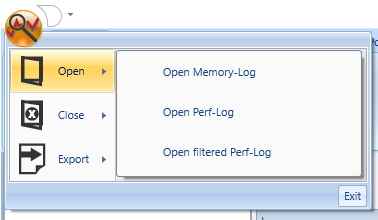
The menu contains three main items:

<div class="contents" id="bkmrk-open---provides-open"><div class="contents"><div class="textblock">1. Open - provides opening different file types of all loaded modules. Drag and drop of files is also working as an alternative.
2. Close - closes an opened file.
3. Export - exports module specific data if supported.

</div></div></div><div drawio-diagram="6860"><img src="https://doc316en.candera.eu/uploads/images/drawio/2024-09/drawing-5-1726835156.png" alt=""/></div>

<div class="contents" id="bkmrk--0"><div class="textblock">  
</div></div>

# Tabs

The default Tabs are General and Online. Additional tabs are added when a new module is loaded. General contains buttons to open the default settings interface, a log window and buttons for common help functions. Online contains the necessary buttons to establish a connection. E.g. configuration, start and stop of a connection. The online tab also contains all module specific interaction between analyzer and target/simulation.

# Settings Window

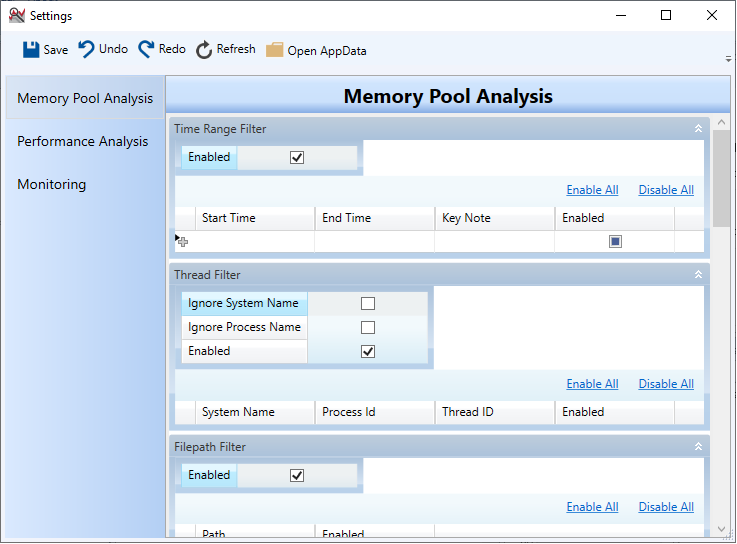
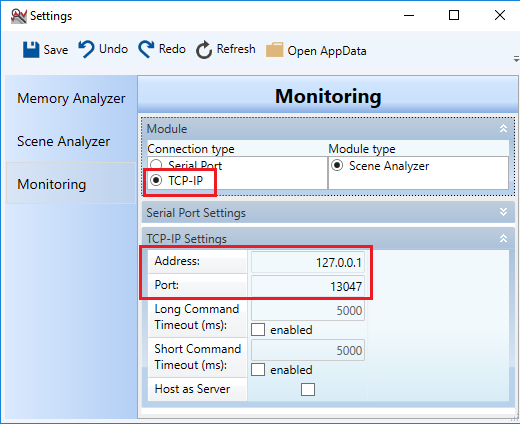
The settings in general contains monitoring settings. Further details can be found in supported communication types section. All possible settings are found in this window. These settings are stored at "%AppData%\\CGIAnalyzer" in your windows filesystem. This location can be easily opened with clicking 'Open AppData'-Button. Settings are saved when pressing the 'Save'-Button or closing the settings interface.

<div drawio-diagram="1169"><img src="https://doc316en.candera.eu/uploads/images/drawio/2023-02/drawing-4-1676511902.png" alt=""/></div>

<div class="contents" id="bkmrk--0"><div class="textblock"></div></div>

# Log Window

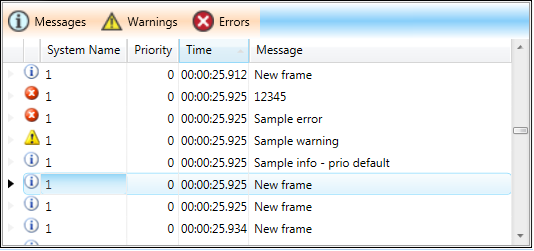
The log window prints all kind of information messages. E.g. connection informations, loading errors and module specific messages.

# Scene Analyzer Overview

# Scene Analyzer feature list

The Analyzer analyzes a Candera Scene Graph and its performance of a 2D or 3D Candera project. It supports:

<div class="contents" id="bkmrk-scene-graph-view-1-d"><div class="contents"><div class="textblock">- Scene Graph View <sup>1</sup>
- Detailed information about the Scene Graph <sup>1</sup>
- Benchmarks related to Scene Graph <sup>1</sup>
- Measurement and data presentation of render processes <sup>2</sup>
- Online – Experiments <sup>1</sup>
- Measurement of key performance indicators <sup>1</sup>
- Storage of measured data

</div></div></div><sup>1</sup> Features available during an online connection with appropriate targets   
<sup>2</sup> Features traced during an online connection with appropriate targets and analyzed afterwards

# Measurement Concepts

#### **Introduction**

##### <a class="anchor" id="bkmrk--11"></a>Measurement Concepts

The Analyzer measurement module allows the user to analyze measurements performed and recorded on the host simulation or target.

It is important to differentiate between the concept of a recorder and the concept of a recording. A recorder is a means to record something, as a DVD recorder is a means to record a DVD.

#### **Recorders** 

The concept of recorders lies at the heart of the Analyzer performance log recording and analysis.

Examples are recorders to record

<div class="contents" id="bkmrk-every-point-in-time%2C"><div class="contents"><div class="textblock">- Every point in time, a new frame starts (an Event Recorder)
- How long it takes an OpenGL call (e.g. glDrawArray) to return to the caller (a Timing Recorder)
- The current CPU or GPU load (a Value Recorder)

</div></div></div>In order to cover these three main areas of interest (events, durations, values), the following six recorder classes were defined:

<div class="contents" id="bkmrk-event-recorder-timin"><div class="contents"><div class="textblock">- <span style="color: rgb(230, 126, 35);">[Event Recorder](https://doc316en.candera.eu/link/268#bkmrk-event-recorder)</span>
- <span style="color: rgb(230, 126, 35);">[Timing Recorder](https://doc316en.candera.eu/link/268#bkmrk-timing-recorder)</span>
- <span style="color: rgb(230, 126, 35);">[Asynchronous Timing Recorder](https://doc316en.candera.eu/link/268#bkmrk-asynchronous-timing-)</span>
- <span style="color: rgb(230, 126, 35);">[Cumulative Timing Recorder](https://doc316en.candera.eu/link/268#bkmrk-cumulative-timing-re)</span>
- <span style="color: rgb(230, 126, 35);">[Value Recorder](https://doc316en.candera.eu/link/268#bkmrk-value-recorder)</span>
- <span style="color: rgb(230, 126, 35);">[Cumulative Value Recorder](https://doc316en.candera.eu/link/268#bkmrk-cumulative-value-rec)</span>

</div></div></div>Every recorder has the following properties:

<div class="contents" id="bkmrk-name%3A-a-name-unique-"><div class="contents"><div class="textblock">- Name: A name unique in the recorders class
- Class: The class to which he belongs

</div></div></div><div class="contents" id="bkmrk--3"><div class="contents"><div class="textblock">---

</div></div></div>#### <a class="anchor" id="bkmrk--13"></a>Recorder Classes

##### <a class="anchor" id="bkmrk--14"></a>Event Recorder

Event Recorders are the simplest recorders. They just record an event at a given point in time.

##### <a class="anchor" id="bkmrk--15"></a>Timing Recorder

Timing Recorders are used to measure durations. Therefore, begin- and end time of a timing recording may differ.

##### <a class="anchor" id="bkmrk--16"></a>Asynchronous Timing Recorder

An Asynchronous Timing Recorder is a timing recorder that starts recording in one execution block and may end in a different one.

##### <a class="anchor" id="bkmrk--17"></a>Cumulative Timing Recorder

A Cumulative Timing Recorder does not keep track of every single timing it was used to record. Instead, it sums up all durations recorded and also keeps track of the number of recordings.

##### <a class="anchor" id="bkmrk--18"></a>Value Recorder

A Value Recorder is used to record a value at a point in time. These values may be signed or unsigned long values.

Values may have the following relationship:

<div class="contents" id="bkmrk-unrelated.-two-recor"><div class="contents"><div class="textblock">- Unrelated. Two recorded values in succession have no relationship.
- Differential. Only the difference after the last recording is recorded.
- Absolute. The full value is always recorded.

</div></div></div>Example for value relationships:

An application records memory consumption and uses a recorder for this task. The application allocates first 1000kb and then 500kb. At the end, the total (absolute) consumption is 1500kb.

<div class="contents" id="bkmrk-when-using-a-differe"><div class="contents"><div class="textblock">- When using a differential Value Recorder, the application would first record the value 1000 and then the value 500.
- When using an absolute Value Recorder, the application would have to first record 1000 and then 1500 to achieve the same effect.

</div></div></div>##### <a class="anchor" id="bkmrk--19"></a>Cumulative Value Recorder

A Cumulative Value Recorder, similar to a Cumulative Timing Recorder, does not keep track of every value it was used to record, but sums up all values and counts the times something was recorded.

#### **Recordings** 

A recording represents actual data recorded, e.g. one new frame event recorded at 1000 ms after system startup. Depending on the recorder used, the following is recorded:

<div class="contents" id="bkmrk-a-signed-or-unsigned"><div class="textblock">- A signed or unsigned long value
- An Event
- A Duration

</div></div>#### **Separation/Interpretation of Data** 

##### <a class="anchor" id="bkmrk--20"></a>Separation of Data and Interpretation Information

In order to gain flexibility, performance log data and the information about how they have to be interpreted and displayed are separated. This separation is reflected on the file system level: performance log data is stored in .perflog files and the meta-information for interpretation is stored in an XML file (PerfDataConfig.xml). The meta-information comprises the following:

<div class="contents" id="bkmrk-the-name-to-use-for-"><div class="contents"><div class="textblock">- The name to use for display
- The foreground color to use for display
- The background color to use for display
- For value recorders:   
    &gt; If the values have to interpreted as signed or unsigned   
    &gt; The relationship of the values (Absolute, Differential, Unrelated)
- For cumulative value recorders:   
    &gt; If the values have to interpreted as signed or unsigned

</div></div></div>The meta-information can be edited using the View Configuration Dialog (see Section <span style="color: rgb(230, 126, 35);">[View Configuration Dialog](https://doc316en.candera.eu/link/271#bkmrk-configuration%C2%A0)</span>).

#### **Views - Filtering - Sampling**

##### <a class="anchor" id="bkmrk--21"></a>Views

A view shows certain aspects of the overall recorded information and thus helps the user to focus on the information he needs to see.

See also:

<div class="contents" id="bkmrk-measurement-views"><div class="contents"><div class="textblock">- <span style="color: rgb(230, 126, 35);">[Measurement Views](https://doc316en.candera.eu/link/271#bkmrk-measurement-views)</span>

</div></div></div>##### <a class="anchor" id="bkmrk--22"></a>Filtering

Each view except Dashboard View and Treemap View allow filtering to display the desired recordings only. Every filtering-enabled view supports filtering by a means of its own and filtering will be described in the corresponding sections. Filtering is always done before sampling.

##### <a class="anchor" id="bkmrk--23"></a>Sampling

Sampling is, similar to filtering, a means to reduce the amount of data displayed. A filtering expression can be arbitrary, whereas a sample always contains all (not-filtered) recordings between two given points in time.

What is or is not contained in a sample is defined by the sampling strategy in use. There are currently two sampling strategies available:

<div class="contents" id="bkmrk-event-sampling-strat"><div class="contents"><div class="textblock">- Event Sampling Strategy
- Duration Sampling Strategy

</div></div></div>If an event sampling strategy is used, all recordings between two events of the same type belong to the same sample (e.g. all recordings between two occurrences of the "New Frame" event). The duration sampling strategy combines all recordings that are e.g. in the first 1000 ms after recording started into one sample.

See also:

<div class="contents" id="bkmrk-sampling-0"><div class="textblock">- <span style="color: rgb(230, 126, 35);">[Sampling](https://doc316en.candera.eu/link/271#bkmrk-sampling%C2%A0)</span>

</div></div>#### **File Filter**   


##### <a class="anchor" id="bkmrk--24"></a>File Filter Overview

A performance log can contain a huge amount of recordings. More recordings lead to a more detailed information about the own system.   
However loading millions of recordings into the Analyzer also leads to a dull application with a barely comprehensible dataset.   
A good way to reduce the amount of data is to filter recordings away which are not useful in the current analysis.   
This step is done during the loading process of a file and is an optional feature.   
In general the loading speed will not be reduced due to the additional filtering effort but the Analyzer will work more smoothly and the data will be concreted to the requested analysis.

#### <a class="anchor" id="bkmrk--25"></a>Open Filtered File

##### <a class="anchor" id="bkmrk--26"></a>GUI Overview

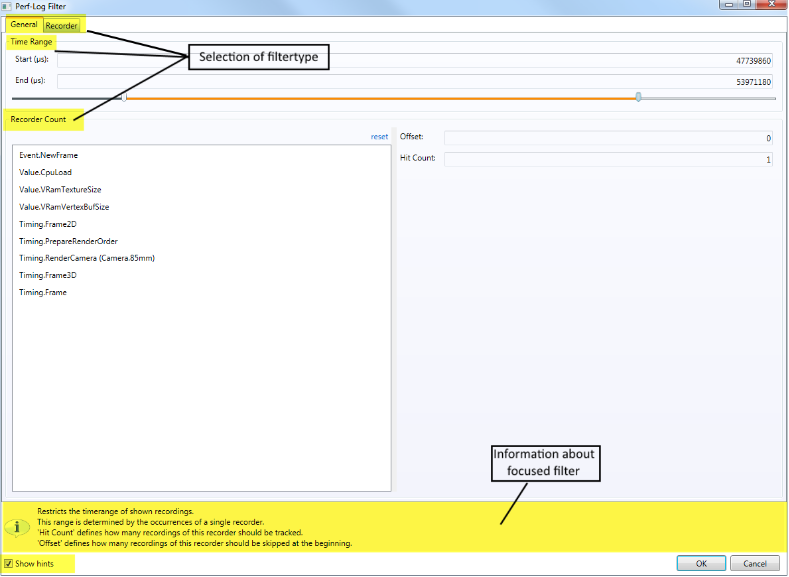
The GUI has two tabs which both contain filter. The first tab (General) contains timespan changing filter.   
The second tab (Recorder) contains a filter to show or hide recordings.   
At the bottom of the window is a information area. It shows a brief overview how a filter is meant to be used.   
This information area can be toggled off, so it will not show any more.

<div drawio-diagram="1172"><img src="https://doc316en.candera.eu/uploads/images/drawio/2023-02/drawing-4-1676512394.png" alt=""/></div>

<div class="contents" id="bkmrk--6"><div class="contents"><div class="textblock">  
</div></div></div>##### <a class="anchor" id="bkmrk--28"></a>Time Range Filter

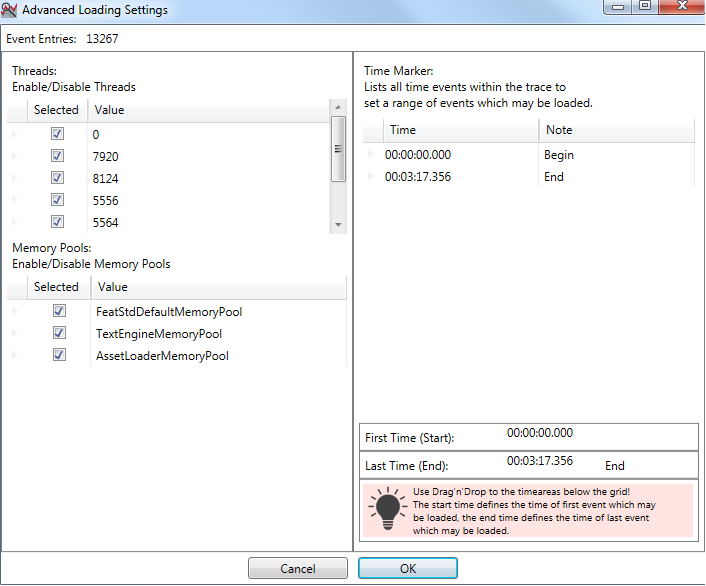
The time range filter is the most basic filter. You select the exact time range which will be loaded. There is a start and an end time. Everything before the start and after the end time will be truncated during loading. This filter applies to all other filter.   
Other filter will operate on the remaining subset of recordings.

##### <a class="anchor" id="bkmrk--29"></a>Recorder Count Filter

The recorder count is a filter which indirectly influences the time range. The concept of this filter is to only show data starting from a specific recording and ending after this recorder type appeared a defined amount of times.   
The filter is split a recorder list and two options.   
Within the recorder list a recorder can be selected. This recorder is used for the occurrence count. The recorders are listed as annotated recorders. So the selection is limited to a recorder subtype.   
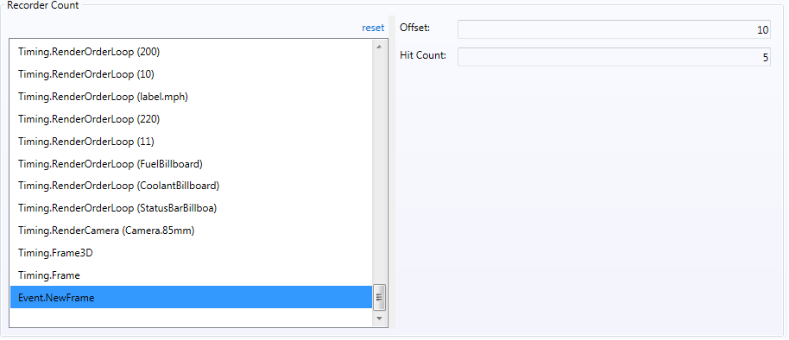
The option Offset defines the amount of skipped recordings of the selected recorder at the beginning.   
The option Hit Count defines how often the recorder occurs. Afterwards the loading of file stops.   
When the hit count is reached this last recording will still be loaded.

Typical use case:   
Select Event: New Frame   
Offset: 10   
Hit Count: 5   
Result: Skips the first 10 frames; shows 4 frames and the occurrence of the 5th new frame event.

<div drawio-diagram="1173"><img src="https://doc316en.candera.eu/uploads/images/drawio/2023-02/drawing-4-1676512426.png" alt=""/></div>

<div class="contents" id="bkmrk--8"><div class="contents"><div class="textblock">  
</div></div></div>##### <a class="anchor" id="bkmrk--31"></a>Recorder Count Filter

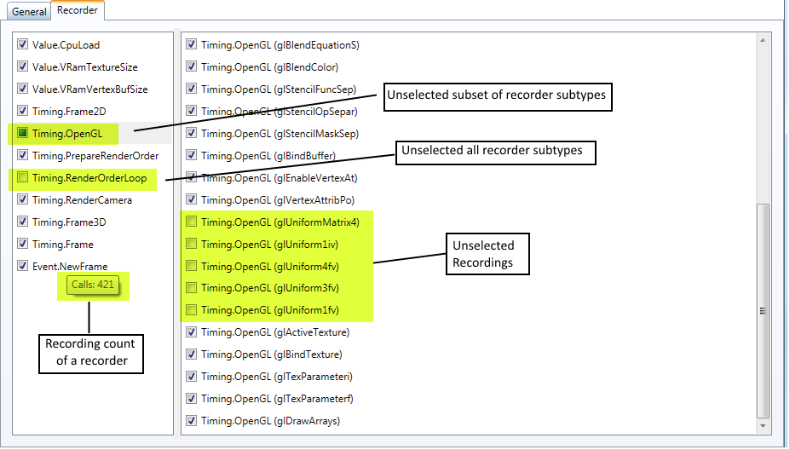
The recorder selection filter is used to hide specific recorder (sub-)types.   
A type is based on recorder type and recorder ID. The subtype of such a recorder takes the annotations into account. The different subtypes or a whole type can be (un-)selected. An unselected recorder will not be loaded. Its nested recordings will be moved to the recording above.   
Brief example:   
A duration recording (A) contains two occurrences of another duration recording (B).   
Recording B contains additional recordings (C). Unselecting the recorder of recording B will hide all occurrences of B.   
The additional recordings C will be moved to A as its parent.

<div drawio-diagram="1174"><img src="https://doc316en.candera.eu/uploads/images/drawio/2023-02/drawing-4-1676512445.png" alt=""/></div>

<div class="contents" id="bkmrk--10"></div>

# Measurement User Interface

#### **User Interface** 

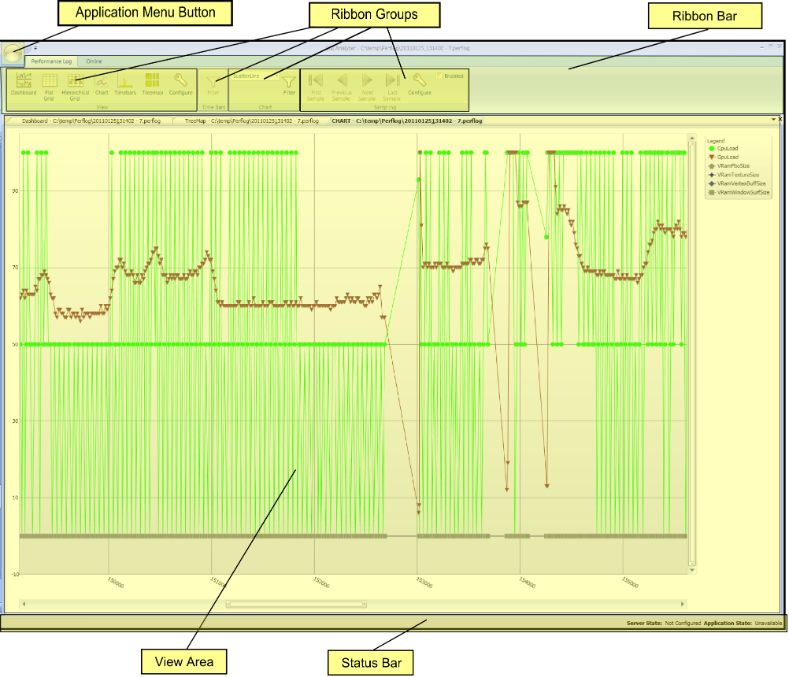
The User Interface is divided in 3 areas:

<div class="contents" id="bkmrk-ribbon-bar-view-area"><div class="contents"><div class="textblock">- Ribbon bar
- View area
- Status bar

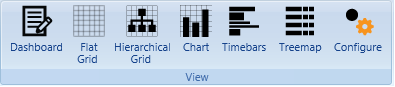
</div></div></div>The ribbon bar is subdivided into groups of controls dedicated to a specific task - ribbon groups. The View Ribbon Group for example allows configuring the display of, opening of, and switching between views.

<div drawio-diagram="1185"><img src="https://doc316en.candera.eu/uploads/images/drawio/2023-02/drawing-4-1676513010.png" alt=""/></div>

<div class="contents" id="bkmrk--1"><div class="contents"><div class="textblock">  
</div></div></div>Analyzer allows Performance Logs to be viewed from different vantage points (views). Each view abstracts from the total amount of data and information to allow the user to easier concentrate on and find the information he searches.

The following views are supported and described in the subsequent sections:

<div class="contents" id="bkmrk-performance-dashboar"><div class="contents"><div class="textblock">- <span style="color: rgb(230, 126, 35);">[Performance Dashboard View:](https://doc316en.candera.eu/link/271#bkmrk-performance-dashboar-0)</span> An overview of key performance indicators
- <span style="color: rgb(230, 126, 35);">[Chart View:](https://doc316en.candera.eu/link/271#bkmrk-chart-view)</span> A view of the trajectories of all value recordings
- <span style="color: rgb(230, 126, 35);">[Time Bars View:](https://doc316en.candera.eu/link/271#bkmrk-time-bars-view)</span> A chronological as well as hierarchical view of all recordings
- <span style="color: rgb(230, 126, 35);">[Grid Views:](https://doc316en.candera.eu/link/271#bkmrk-grid-view)</span> Views in table form   
    &gt; Flat View: A flat view on all recordings   
    &gt; Hierarchical View: A hierarchical (nested) view on all recordings
- <span style="color: rgb(230, 126, 35);">[Treemap View:](https://doc316en.candera.eu/link/271#bkmrk-treemap-view) </span>A nested view of the timing recorders Access to opening and switching between views, as well as configuration of views is provided by the View Ribbon Group.

</div></div></div><div drawio-diagram="1186"><img src="https://doc316en.candera.eu/uploads/images/drawio/2023-02/drawing-4-1676513032.png" alt=""/></div>

<div class="contents" id="bkmrk--3"><div class="textblock">  
</div></div>#### **Application Menu**   


The application menu holds commands for opening and closing a performance log, as well as exporting performance log data.

<div drawio-diagram="5307"><img src="https://doc316en.candera.eu/uploads/images/drawio/2024-02/drawing-5-1708678940.png" alt=""/></div>

<div class="contents" id="bkmrk--6"><div class="textblock">  
</div></div>#### **Configuration**   


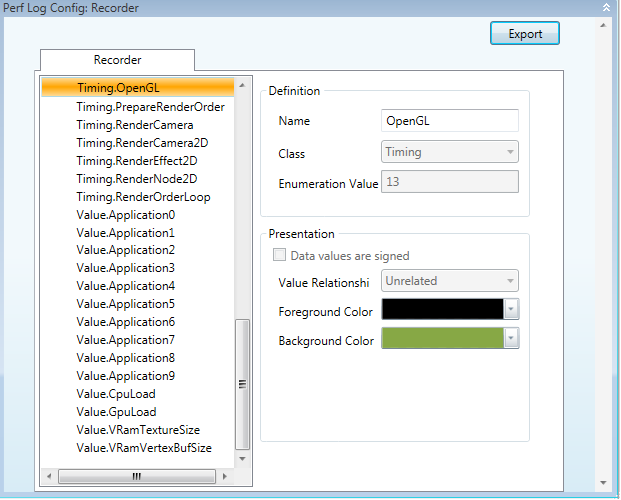
The display of performance logs can be configured using the Performance Log Configuration dialog. The dialog can be opened from the "View" Ribbon Group.

The configuration dialog (depicted in Figure 4) allows the configuration of recording appearances in views as well as how the recordings are interpreted.

On the left side of the dialog, there is a list of all recorder names used. The recorder names displayed are fully qualified, consisting of the recorder class as prefix and the display name of the recorder. On the right side, the properties of the currently selected recorder are displayed and can be changed.

Changeable for all recorders are the following properties:

<div class="contents" id="bkmrk-name%3A-the-name-of-th"><div class="contents"><div class="textblock">- Name: The name of the recorder displayed in all views
- Foreground color: Text color for recordings in Time Bars View
- Background color: Background color for recordings in Time Bars View, Color for trajectory of recordings in Chart View

</div></div></div>Changeable properties for value recorders are:

<div class="contents" id="bkmrk-data-values-are-sign"><div class="contents"><div class="textblock">- Data values are signed: The displayed values are treated as signed values
- Value relationship:   
    &gt; Unrelated: Recorded values are unrelated   
    &gt; Differential: The recorded values are only the difference from the last recorded value, not the total (absolute) value.   
    &gt; Absolute: The values recorded are always equal to the absolute values.

</div></div></div><div drawio-diagram="1188"><img src="https://doc316en.candera.eu/uploads/images/drawio/2023-02/drawing-4-1676514012.png" alt=""/></div>

<div class="contents" id="bkmrk--9"><div class="textblock">  
</div></div>#### **Performance Log Export**   


##### <a class="anchor" id="bkmrk--86"></a>Export of Performance Log

The export of the currently open performance log is available via the application menu.

Currently, exporting of performance log data is supported in the following formats:

<div class="contents" id="bkmrk-microsoft-excel-2007"><div class="contents"><div class="textblock">- Microsoft Excel 2007 (XLSX)
- Comma Separated Values (CSV)

</div></div></div>Since Excel worksheets allow only a limited number of rows, data is distributed over several worksheets. Using this approach, a theoretical total number of 65000x255 rows can be stored in one Excel file. The export of data takes some time, so please be patient.

#### **Sampling**   


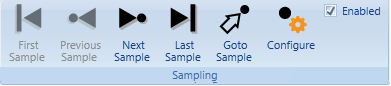
The figure shows the Ribbon Group for sampling. All sampling functionality is available via these controls.

<div drawio-diagram="1189"><img src="https://doc316en.candera.eu/uploads/images/drawio/2023-02/drawing-4-1676514083.png" alt=""/></div>

<div class="contents" id="bkmrk--13"><div class="contents"><div class="textblock">  
</div></div></div>Usage of sampling requires two steps:

<div class="contents" id="bkmrk-configuration-of-sam"><div class="contents"><div class="textblock">- Configuration of sampling for a given view. The sampling configuration dialog can be opened via the "Configure" button.
- Enabling of sampling for the view. Sampling can be enabled via the "enable" checkbox

</div></div></div>Navigation between samples is supported by the navigation buttons in the Sampling Ribbon Group or keyboard shortcuts (see the end of this document for a list).   
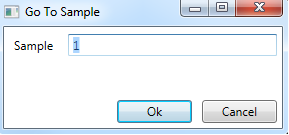
Also, the user can directly jump to a desired sample by pressing the "Goto Sample" button and specifying the desired sample in the provided dialog.

<div drawio-diagram="1190"><img src="https://doc316en.candera.eu/uploads/images/drawio/2023-02/drawing-4-1676514099.png" alt=""/></div>

<div class="contents" id="bkmrk--15"><div class="textblock">  
</div></div>#### **<span style="color: rgb(0, 0, 0);">Measurement Views</span>**


##### **<span style="color: rgb(0, 0, 0);">Performance Dashboard View</span>**

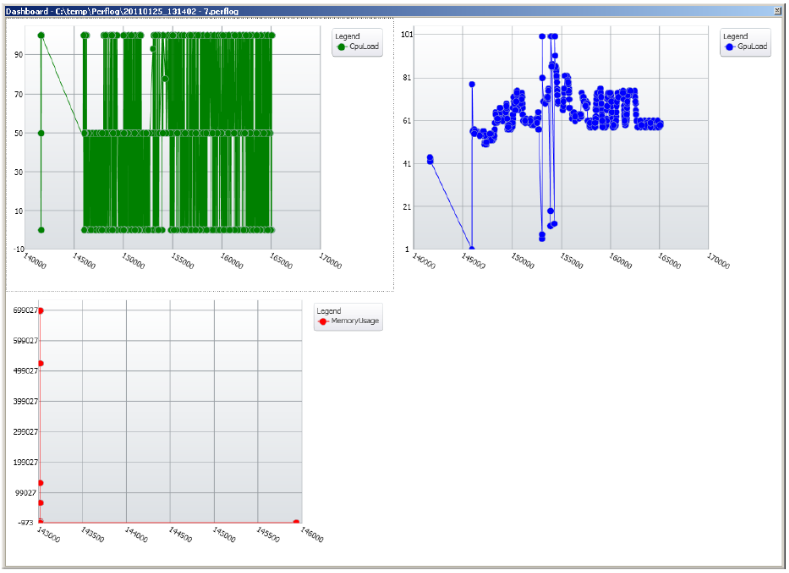
The Performance Dashboard View is the first view, automatically displayed when opening a performance log. It displays recordings of up to four Value Recorders. The actual Value Recorders used here can be customized. After installation, however, CPU load, GPU load and memory allocations are displayed (if available). The figure shows a typical Dashboard View.

<div drawio-diagram="1191"><img src="https://doc316en.candera.eu/uploads/images/drawio/2023-02/drawing-4-1676514715.png" alt=""/></div>

<div class="contents" id="bkmrk--18"><div class="contents"><div class="textblock">  
</div></div></div>For every chart, the x-axis represents the elapsed time and the y-axis a value scale. To the right of each chart, there is a legend for the values displayed in this chart. There are no interactions possible with this view type. Only the values are displayed upon hovering over graphs.

##### <span style="color: rgb(0, 0, 0);">**Chart View**</span>

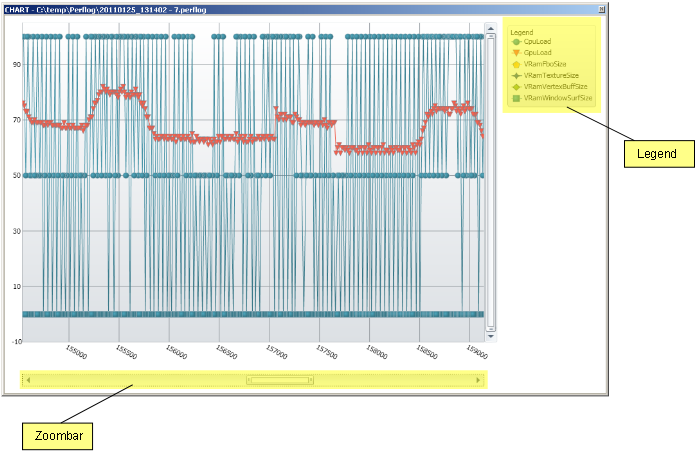
A Chart View, as shown in the figure displays only Value Recordings.

<div drawio-diagram="1192"><img src="https://doc316en.candera.eu/uploads/images/drawio/2023-02/drawing-4-1676514801.png" alt=""/></div>

<div class="contents" id="bkmrk--21"><div class="contents"><div class="textblock">  
</div></div></div>On the x-axis, a time scale is displayed, on the y-axis a common scale for all values. To the right there is a legend for the values currently displayed.

Below the x-axis and to the right of the y-axis, there are so-called zoom bars. They allow the user to zoom-in to as well as pan the chart. Panning is also allowed by left-clicking the chart and dragging it to the left or the right.

By pressing the left shift button, clicking the left mouse button, and dragging the mouse, a part of the chart can be selected for zooming in.

Hovering over a trajectory or a marker displays a tooltip with information about the corresponding value.

<div class="contents" id="bkmrk--22"><div class="contents"><div class="textblock">  
</div></div></div>##### <a class="anchor" id="bkmrk--92"></a>Associated Ribbon Group

<div drawio-diagram="1193"><img src="https://doc316en.candera.eu/uploads/images/drawio/2023-02/drawing-4-1676514818.png" alt=""/></div>

<div class="contents" id="bkmrk--24"><div class="contents"><div class="textblock">  
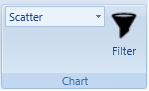
</div></div></div>The Chart Ribbon Group comprises UI elements for configuring the currently active Chart View:

<div class="contents" id="bkmrk-filtering-is-availab"><div class="contents"><div class="textblock">- Filtering is available via the "Filter" button
- Chart interpolation settings are available from the combo box.

</div></div></div>The following interpolations are supported:

<div class="contents" id="bkmrk-scatter%3A-no-interpol"><div class="contents"><div class="textblock">- Scatter: No interpolation is performed; only markers are displayed
- Scatter Line: Simple line interpolation is performed by connection successive markers
- Scatter Spline: Spline interpolation is used.

</div></div></div>##### <a class="anchor" id="bkmrk--94"></a>Filtering

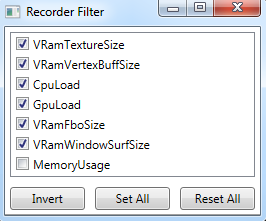
Filtering allows the user to reduce the set of displayed Value Recorders to a desired subset. The shows the recorder filter editor opened via the "Filter" button in the Chart Ribbon Group.

<div drawio-diagram="1194"><img src="https://doc316en.candera.eu/uploads/images/drawio/2023-02/drawing-4-1676514833.png" alt=""/></div>

<div class="contents" id="bkmrk--27"><div class="contents"><div class="textblock">  
</div></div></div>En- and disabling of filters is immediately reflected in the chart.

<div class="contents" id="bkmrk-%22invert%22-inverts-the"><div class="contents"><div class="textblock">- "Invert" inverts the current selection of recorders,
- "Set All" enables all recorders,
- "Reset All" disables all recorders in the current Chart View.

</div></div></div>##### Sampling

Sampling is available via the Sampling Ribbon Group. See section "Filtering" on page <span style="color: rgb(230, 126, 35);">[Views - Filtering - Sampling](https://doc316en.candera.eu/link/268#bkmrk-views---filtering---)</span> for details.

##### **<span style="color: rgb(0, 0, 0);">Grid View</span>**

Flat and Hierarchical Grid Views allow display of all recordings in a grid similar to Microsoft Excel. Table 1 lists and explains the displayed columns.

##### <a class="anchor" id="bkmrk--98"></a>Grid View Columns

<div class="contents" id="bkmrk-column-header-title-"><div class="contents"><div class="textblock"><table border="1" cellpadding="5" cellspacing="0" style="border-collapse: collapse; width: 800px; border-width: 1px; border-spacing: 0px;" width="900"><tbody><tr bgcolor="#d4d4d4"><th style="border-width: 1px; padding: 5px;" width="25%">**Column Header**</th><th style="border-width: 1px; padding: 5px;" width="75%">**Title Description**</th></tr><tr><td style="border-width: 1px; padding: 5px;">\#</td><td style="border-width: 1px; padding: 5px;">Sequence number of the recording. Numbering starts at zero.</td></tr><tr><td style="border-width: 1px; padding: 5px;">Recorder #</td><td style="border-width: 1px; padding: 5px;">Sequence number of the recorder. This is the number of the recorder in the sequence of recorders with same class and name. Numbering starts at zero.</td></tr><tr><td style="border-width: 1px; padding: 5px;">Recorder Class</td><td style="border-width: 1px; padding: 5px;">The class of the recorder. See section 4.1.1 for a list of available recorder classes.</td></tr><tr><td style="border-width: 1px; padding: 5px;">Recorder Name</td><td style="border-width: 1px; padding: 5px;">The unique name of the recorder within its class</td></tr><tr><td style="border-width: 1px; padding: 5px;">Recording Begin</td><td style="border-width: 1px; padding: 5px;">The time, this recording started. Unit is milliseconds.</td></tr><tr><td style="border-width: 1px; padding: 5px;">Recording End</td><td style="border-width: 1px; padding: 5px;">The time, this recording ended. Unit is milliseconds.</td></tr><tr><td style="border-width: 1px; padding: 5px;">Recording Duration</td><td style="border-width: 1px; padding: 5px;">The difference between Recording Begin and Recording End. Unit is milliseconds.</td></tr><tr><td style="border-width: 1px; padding: 5px;">Self Duration</td><td style="border-width: 1px; padding: 5px;">The amount of time, this recording contributed to the recorded duration (if nested). Unit is milliseconds.</td></tr><tr><td style="border-width: 1px; padding: 5px;">Effective Duration</td><td style="border-width: 1px; padding: 5px;">Depending on the recorder class, the effective duration yields the following:

- Cumulative Timing Recording: The accumulated duration
- Asynchronous Timing Recording: The asynchronous duration
- Other recorder classes: The self duration

Unit is milliseconds.

</td></tr><tr><td style="border-width: 1px; padding: 5px;">Time To Next Recording</td><td style="border-width: 1px; padding: 5px;">Unit is milliseconds.</td></tr><tr><td style="border-width: 1px; padding: 5px;">Annotation</td><td style="border-width: 1px; padding: 5px;">A string enabling further differentiation between Recordings with same class and same name. The OpenGL timing recorder uses annotations e.g. to differentiate between calls of different functions.</td></tr><tr><td style="border-width: 1px; padding: 5px;">Call Count</td><td style="border-width: 1px; padding: 5px;">Depending on the recorder class, the call count yields the following: - Cumulative Timing Recorder: The number of recordings of this recorder
- Cumulative Value Recorder: The number of recordings of this recorder
- Other recorder classes: No value

</td></tr><tr><td style="border-width: 1px; padding: 5px;">Value</td><td style="border-width: 1px; padding: 5px;">Depending on the recorder class, the value yields the following: - Value Recorder The value
- Otherwise no value

</td></tr><tr><td style="border-width: 1px; padding: 5px;">Absolute Value</td><td style="border-width: 1px; padding: 5px;">Depending on the recorder class, the absolute value yields the following: - Cumulative Value Recorder The absolute (up until then cumulated) value
- Other recorder classes no value

</td></tr></tbody></table>

</div></div></div>##### <a class="anchor" id="bkmrk--99"></a>Filtering

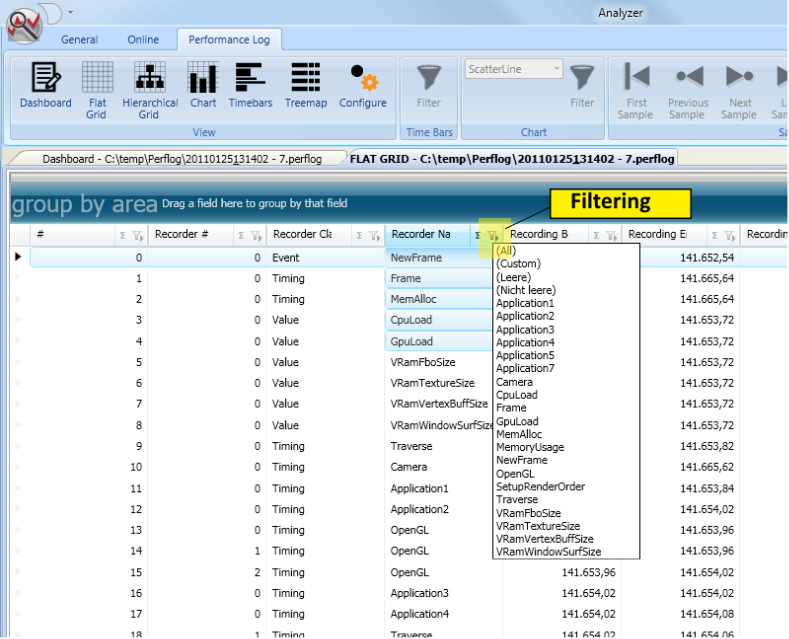
Filtering in the grid views is available via the grid column headers as depicted in Figure 11. The filtering options are:

<div drawio-diagram="1195"><img src="https://doc316en.candera.eu/uploads/images/drawio/2023-02/drawing-4-1676514987.png" alt=""/></div>

<div class="contents" id="bkmrk--32"><div class="contents"><div class="textblock">  
</div></div></div>##### <a class="anchor" id="bkmrk--101"></a>Grid Filtering Options

<div class="contents" id="bkmrk-filter-option-descri"><div class="contents"><div class="textblock"><table border="1" cellpadding="5" cellspacing="0" style="border-collapse: collapse; width: 800px; border-width: 1px; border-spacing: 0px;" width="900"><tbody><tr bgcolor="#d4d4d4"><th style="border-width: 1px; padding: 5px;" width="20%">**Filter Option**</th><th style="border-width: 1px; padding: 5px;" width="65%">**Description**</th><th style="border-width: 1px; padding: 5px;" width="15%">**Only Numeric**</th></tr><tr><td style="border-width: 1px; padding: 5px;">All</td><td style="border-width: 1px; padding: 5px;">Displays all recordings</td><td style="border-width: 1px; padding: 5px;">No</td></tr><tr><td style="border-width: 1px; padding: 5px;">Custom</td><td style="border-width: 1px; padding: 5px;">Displays a dialog for constructing a custom filter expression</td><td style="border-width: 1px; padding: 5px;">No</td></tr><tr><td style="border-width: 1px; padding: 5px;">Empty</td><td style="border-width: 1px; padding: 5px;">Display all recordings that contain no value in this column</td><td style="border-width: 1px; padding: 5px;">No</td></tr><tr><td style="border-width: 1px; padding: 5px;">Not Empty</td><td style="border-width: 1px; padding: 5px;">Display all recordings that contain a value</td><td style="border-width: 1px; padding: 5px;">No</td></tr><tr><td style="border-width: 1px; padding: 5px;">Below Average</td><td style="border-width: 1px; padding: 5px;">All recordings that have values below average in this column</td><td style="border-width: 1px; padding: 5px;">Yes</td></tr><tr><td style="border-width: 1px; padding: 5px;">Above Average</td><td style="border-width: 1px; padding: 5px;">All recordings that have values above average in this column</td><td style="border-width: 1px; padding: 5px;">Yes</td></tr><tr><td style="border-width: 1px; padding: 5px;">Lower 10</td><td style="border-width: 1px; padding: 5px;">The 10 lowest values in this column</td><td style="border-width: 1px; padding: 5px;">Yes</td></tr><tr><td style="border-width: 1px; padding: 5px;">Upper 10</td><td style="border-width: 1px; padding: 5px;">The ten highest values in this column</td><td style="border-width: 1px; padding: 5px;">Yes</td></tr><tr><td style="border-width: 1px; padding: 5px;">Lower 10-Quantile</td><td style="border-width: 1px; padding: 5px;">In descriptive statistics, a 10-quantile (also known as decile) is any of the nine values that divide the sorted data into ten equal parts, so that each part represents 1/10 of the sample or population.   
Thus, the lower 10-Quantile is the 1st decile and contains the lowest 10% of data, i.e. the 10th percentile.</td><td style="border-width: 1px; padding: 5px;">Yes</td></tr><tr><td style="border-width: 1px; padding: 5px;">Upper 10-Quantile</td><td style="border-width: 1px; padding: 5px;">The upper 10-Quantile is the 10th decile and contains the highest 10% of data.</td><td style="border-width: 1px; padding: 5px;">Yes</td></tr></tbody></table>

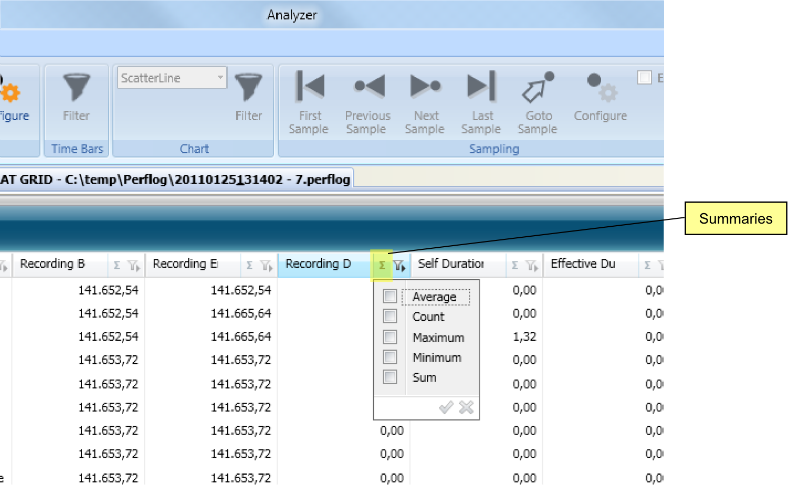
</div></div></div><div class="contents" id="bkmrk-summaries"><div class="contents"><div class="textblock"><a class="anchor" id="bkmrk--102" style="font-size: 1.4em; font-weight: 400; background-color: rgb(255, 255, 255);"></a><span style="color: rgb(34, 34, 34); font-size: 1.4em; font-weight: 400;">Summaries</span></div></div></div>Summaries are small evaluations over values in one column. Summaries can be en- and disabled via the grid column headers.

<div drawio-diagram="1196"><img src="https://doc316en.candera.eu/uploads/images/drawio/2023-02/drawing-4-1676515039.png" alt=""/></div>

<div class="contents" id="bkmrk--36"><div class="contents"><div class="textblock">  
</div></div></div>##### <a class="anchor" id="bkmrk--104"></a>Grid View Summary Options

<div class="contents" id="bkmrk-summary-option-descr"><div class="contents"><div class="textblock"><table border="1" cellpadding="5" cellspacing="0" style="border-collapse: collapse; width: 800px; border-width: 1px; border-spacing: 0px;" width="900"><tbody><tr bgcolor="#d4d4d4"><th style="border-width: 1px; padding: 5px;" width="20%">**Summary Option**</th><th style="border-width: 1px; padding: 5px;" width="65%">**Description**</th><th style="border-width: 1px; padding: 5px;" width="15%">**Only Numeric**</th></tr><tr><td style="border-width: 1px; padding: 5px;">Count</td><td style="border-width: 1px; padding: 5px;">Number of rows displayed</td><td style="border-width: 1px; padding: 5px;">No</td></tr><tr><td style="border-width: 1px; padding: 5px;">Average</td><td style="border-width: 1px; padding: 5px;">The average over all displayed values</td><td style="border-width: 1px; padding: 5px;">Yes</td></tr><tr><td style="border-width: 1px; padding: 5px;">Maximum</td><td style="border-width: 1px; padding: 5px;">The highest value</td><td style="border-width: 1px; padding: 5px;">No</td></tr><tr><td style="border-width: 1px; padding: 5px;">Minimum</td><td style="border-width: 1px; padding: 5px;">The lowest value</td><td style="border-width: 1px; padding: 5px;">No</td></tr><tr><td style="border-width: 1px; padding: 5px;">Sum</td><td style="border-width: 1px; padding: 5px;">The sum over all values</td><td style="border-width: 1px; padding: 5px;">Yes</td></tr></tbody></table>

</div></div></div>##### <a class="anchor" id="bkmrk--105"></a>Grouping

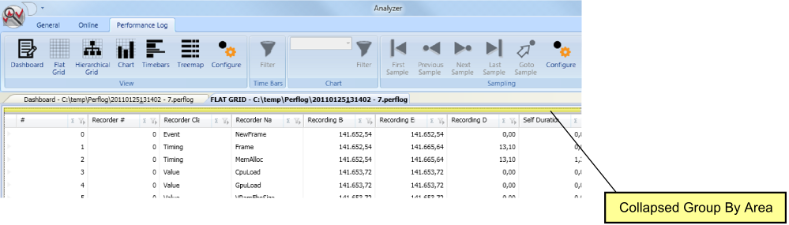
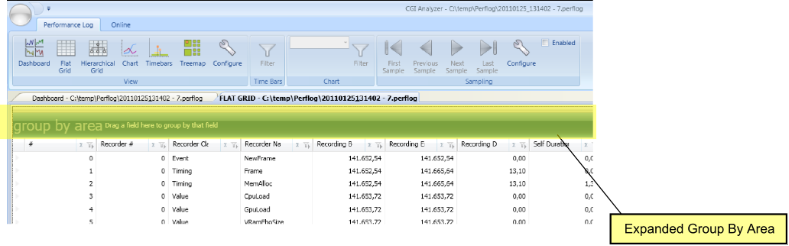
A grouping is a planned arrangement of all recordings by values in one column. Using this feature, it is possible to impose a hierarchical structure on the recordings. Grouping is accomplished by dragging a column header to the group-by-area. By default the group by area is collapsed.

<div drawio-diagram="1197"><img src="https://doc316en.candera.eu/uploads/images/drawio/2023-02/drawing-4-1676515075.png" alt=""/></div>

<div class="contents" id="bkmrk--39"><div class="contents"><div class="textblock">  
</div></div></div>In order to restore the group by area, left-click on it or drag a column header and drop in on the collapsed group by area.

<div drawio-diagram="1198"><img src="https://doc316en.candera.eu/uploads/images/drawio/2023-02/drawing-4-1676515112.png" alt=""/></div>

<div class="contents" id="bkmrk--41"><div class="contents"><div class="textblock">  
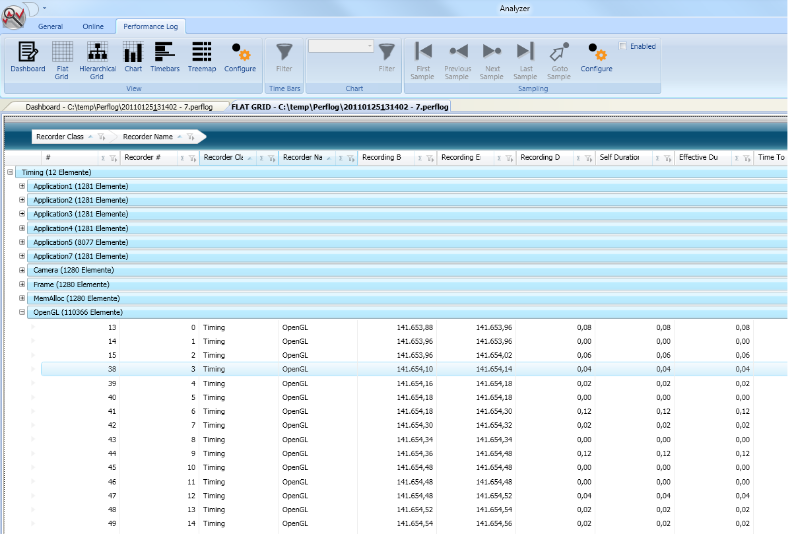
</div></div></div>Groupings can be chained, i.e. the recordings can first be grouped by values of one column, than by values of another column, and so on. The next figure shows recordings first grouped by recorder class and then by recorder name in order to collect all OpenGL recorders in one group.

<div drawio-diagram="1199"><img src="https://doc316en.candera.eu/uploads/images/drawio/2023-02/drawing-4-1676515132.png" alt=""/></div>

<div class="contents" id="bkmrk--43"><div class="textblock">  
</div></div>##### <span style="color: rgb(0, 0, 0);">**Time Bars View**</span>

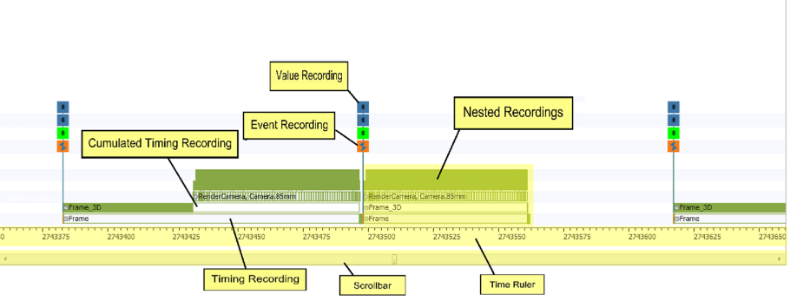
Time Bars View displays all recordings arranged along a timeline. Below the actual time bars, there is a scrollbar for panning the displayed time frame. The time ruler is situated between time bars and the scrollbar. Here, time values in milliseconds and a cursor with the current time under the mouse pointer are displayed.

These icons are used to distinguish the different recorder classes:

<div class="contents" id="bkmrk-time-recording-value"><div class="contents"><div class="textblock"><table border="0" cellspacing="10" style="width: 40.3704%; height: 237.969px;"><tbody><tr style="height: 83.1875px;" valign="middle"><td style="width: 20.7951%; height: 83.1875px;">[![measurement_timebar-icon_1.PNG](https://doc316en.candera.eu/uploads/images/gallery/2023-02/scaled-1680-/measurement-timebar-icon-1.PNG)](https://doc316en.candera.eu/uploads/images/gallery/2023-02/measurement-timebar-icon-1.PNG)

<div class="image">  
</div></td><td style="width: 78.8847%; height: 83.1875px;">Time Recording</td></tr><tr style="height: 66.3906px;" valign="middle"><td style="width: 20.7951%; height: 66.3906px;">[![measurement_timebar-icon_2.PNG](https://doc316en.candera.eu/uploads/images/gallery/2023-02/scaled-1680-/measurement-timebar-icon-2.PNG)](https://doc316en.candera.eu/uploads/images/gallery/2023-02/measurement-timebar-icon-2.PNG)

</td><td style="width: 78.8847%; height: 66.3906px;">Value Recording</td></tr><tr style="height: 28.7969px;" valign="middle"><td style="width: 20.7951%; height: 28.7969px;">[![measurement_timebar-icon_3.PNG](https://doc316en.candera.eu/uploads/images/gallery/2023-02/scaled-1680-/measurement-timebar-icon-3.PNG)](https://doc316en.candera.eu/uploads/images/gallery/2023-02/measurement-timebar-icon-3.PNG)

</td><td style="width: 78.8847%; height: 28.7969px;">Event Recording</td></tr><tr style="height: 29.7969px;" valign="middle"><td style="width: 20.7951%; height: 29.7969px;">[![measurement_timebar-icon_4.PNG](https://doc316en.candera.eu/uploads/images/gallery/2023-02/scaled-1680-/measurement-timebar-icon-4.PNG)](https://doc316en.candera.eu/uploads/images/gallery/2023-02/measurement-timebar-icon-4.PNG)

</td><td style="width: 78.8847%; height: 29.7969px;">Asynchronous Recording</td></tr><tr style="height: 29.7969px;" valign="middle"><td style="width: 20.7951%; height: 29.7969px;">[![measurement_timebar-icon_5.PNG](https://doc316en.candera.eu/uploads/images/gallery/2023-02/scaled-1680-/measurement-timebar-icon-5.PNG)](https://doc316en.candera.eu/uploads/images/gallery/2023-02/measurement-timebar-icon-5.PNG)

</td><td style="width: 78.8847%; height: 29.7969px;">Cumulative Recording (timing or value)</td></tr></tbody></table>

</div></div></div><div drawio-diagram="1208"><img src="https://doc316en.candera.eu/uploads/images/drawio/2023-02/drawing-4-1676515293.png" alt=""/></div>

<div class="contents" id="bkmrk--47"><div class="contents"><div class="textblock">  
</div></div></div>##### <a class="anchor" id="bkmrk--110"></a>Associated Ribbon Group

The next figure shows the ribbon group associated with the Time Bars View. It contains only one button for displaying the recorder filtering dialog.

<div drawio-diagram="1209"><img src="https://doc316en.candera.eu/uploads/images/drawio/2023-02/drawing-4-1676515305.png" alt=""/></div>

<div class="contents" id="bkmrk--50"><div class="contents">  
</div></div>##### <a class="anchor" id="bkmrk--112"></a>Filtering, 

Filtering here works analogous to filtering in the Chart View. Via the "Filter" button on the associated ribbon group the filter editor dialog is opened. En- and disabling of filters is immediately reflected in the chart.

<div class="contents" id="bkmrk-%22invert%22-inverts-the-0"><div class="contents"><div class="textblock">- "Invert" inverts the current selection of recorders,
- "Set All" enables all recorders,
- "Reset All" disables all recorders in the current Chart View.

</div></div></div>##### Sampling

Sampling is not supported for the Time Bars View.

##### **Zooming**

<div class="contents" id="bkmrk-zooming-is-supported"><div class="contents"><div class="textblock">Zooming is supported via two mechanisms:  
</div></div></div><div class="contents" id="bkmrk-mouse-wheel-keyboard"><div class="contents"><div class="textblock">- Mouse wheel
- Keyboard shortcuts

</div></div></div>Point the mouse pointer to the time you wish to zoom into. By using the mouse wheel or pressing Ctrl and the "+" or "-" button, you can zoom in to or out of this point in time. See section <span style="color: rgb(230, 126, 35);">[Keyboard Shortcuts](https://doc316en.candera.eu/link/261#bkmrk-page-title)</span> for a list of all available keyboard shortcuts.

##### <span style="color: rgb(0, 0, 0);">**Treemap View**</span>

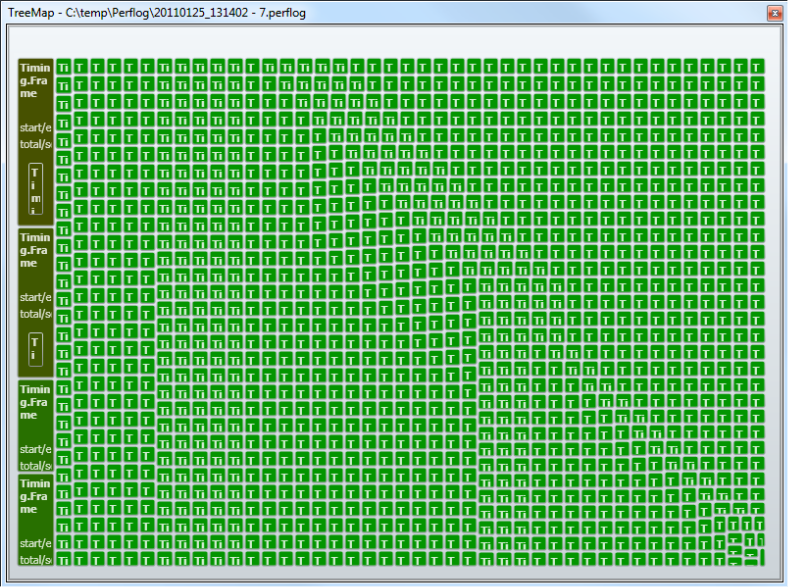
The Treemap View only displays timing recordings along with their nesting. The following figure depicts the Treemap View of a performance log.

<div drawio-diagram="1210"><img src="https://doc316en.candera.eu/uploads/images/drawio/2023-02/drawing-4-1676515425.png" alt=""/></div>

<div class="contents" id="bkmrk--56"><div class="contents"><div class="textblock">  
</div></div></div>This view shows all timing recordings ordered by decreasing recording duration. The timing recording with the highest performance impact on one nesting level is drawn in the upper left corner, the recording with the lowest impact in the lower right corner.

Left-clicking an item in the treemap drills into this item. Right-clicking an item returns to its parent.

##### <a class="anchor" id="bkmrk--116"></a>Filtering

Filtering is not available for the Treemap View.

##### <a class="anchor" id="bkmrk--117"></a>Sampling

Sampling is available via the Sampling Ribbon Group.

# Data Acquisition Overview

The monitoring system provides several different ways to collect and analyze measured data:

<div class="contents" id="bkmrk-offline-collection-o"><div class="contents"><div class="textblock">- Offline collection
- Online collection
- Analysis at runtime
- Offline-Analysis of collected data

</div></div></div>There are two different types of data which can be gathered:

<div class="contents" id="bkmrk-scene-graph-related-"><div class="contents"><div class="textblock">- Scene Graph related data
- Performance based data (Recordings) The Scene Graph related data grabs the actual Scene Graph. This is only available during an established connection between Analyzer and target application.

</div></div></div>The performance based data provides key performance indicators which gives information about the current performance on target application. Therefore, it is also used during an established connection. The performance based data also provides recordings which can be gathered during runtime of the application. These data are meant to be analyzed afterwards.

#### **Performance Data Recording**

In order to record performance data to be analyzed, the following means are provided:

##### <a class="anchor" id="bkmrk--2"></a>Dumping to Local Files

Candera supports dumping of performance data to local files on the target system.  
Refer to class

<div class="contents" id="bkmrk-%3Cfeatstd-root%3E-%5Cfeat"><div class="contents"><div class="textblock">- &lt;FEATSTD-ROOT&gt; \\featstd\\src\\FeatStd\\Monitor\\PerformanceRecording\\FileDumper.h.

</div></div></div>The Player part of CGI Studio Releases is preconfigured to use this class for periodically dumping performance logs to the local file system, i.e. to the same location the asset is being loaded from. It is only required to enable performance recording in the CGIApplication via the respective macro call during application initialization:

```
CANDERA_PERF_SET_ENABLED(true);
```

The generated performance log files need to be transferred to the host system running Analyzer manually.

##### <a class="anchor" id="bkmrk--3"></a>Online Transfer of Performance Data

As an alternative to local file dumping, Analyzer can be used to fetch performance logs via a TCP/IP or Serial connection, which is also used for running online experiments on the target. This way, a performance log can be stored already on the host system running Analyzer for further analysis.

<div class="contents" id="bkmrk-for-online-transfer%2C"><div class="contents"><div class="textblock"><dl class="note"><dt></dt><dd><p class="callout info">For online transfer, there is a buffer limit of 468,75 kB of data, so only the first 468,75 kB of data will be covered in the performance log.</p>

</dd></dl></div></div></div>For setting up the online connection between Analyzer and the target application, refer to section Analysis for more details. The Candera application needs to be in Paused Mode to get a log file via the "Online" tab of Analyzer. Note that "Enable Recording" flag must be enabled.

##### <a class="anchor" id="bkmrk--4"></a>Dumping to Memory

Analyzer supports dumping performance logs to memory (e.g. where no file system is available). Usage for recording is similar to dumping to local files.

Refer to class:

<div class="contents" id="bkmrk-%3Cfeatstd-root%3E-%5Cfeat-0"><div class="contents"><div class="textblock">- &lt;FEATSTD-ROOT&gt; \\featstd\\src\\FeatStd\\Monitor\\PerformanceRecording\\MemoryDumper.h.

</div></div></div>Performance Logs have to be transferred from memory on target to the host computer for usage in Analyzer. The transfer from target memory to a host file is target specific. With the INTEGRITY operating system, Multi can be used for this task.

####   
**Establishing connection**

A connection can be established with selecting a communication type, configuring it and start the connection. Both, target and host, have to be connected by this communication type. It is not restricted which system (target or host) has to be started first.

Currently provided online communication types are:

<div class="contents" id="bkmrk-tcpip-serial-port"><div class="contents"><div class="textblock">- TcpIp
- Serial port

</div></div></div>##### <a class="anchor" id="bkmrk--5"></a>Target Side:

To use the monitor on target side the following cmake flag is required:

```
FEATSTD_MONITOR_TYPE
```

The default value is

```
 FEATSTD_COM_TYPE_NONE 
```

which disables monitoring completely.

Depending on the chosen value additional settings will be added to cmake:

TcpIp:

```
FEATSTD_MONITOR_TCPIP_ADDRESS 
FEATSTD_MONITOR_TCPIP_PORT
FEATSTD_MONITOR_TCPIP_STACK_ENABLED
```

These settings are used to connect to a specific ip-address and a specific port.

Serial Port:

```
FEATSTD_MONITOR_SERIALPORT_ADDRESS
FEATSTD_MONITOR_SERIALPORT_BAUDRATE
```

The baudrate supports common baudrates whereas it is not guaranteed that the target fully supports the given baudrates.

When Player is used as simulation environment, it also asks for these settings. The Player does not know which communication type is in use, so it provides both. Selecting a different communication type as the application uses leads to errors and should be avoided. Nevertheless choosing new settings for given communication type is possible.

##### <a class="anchor" id="bkmrk--6"></a>Analyzer Side:

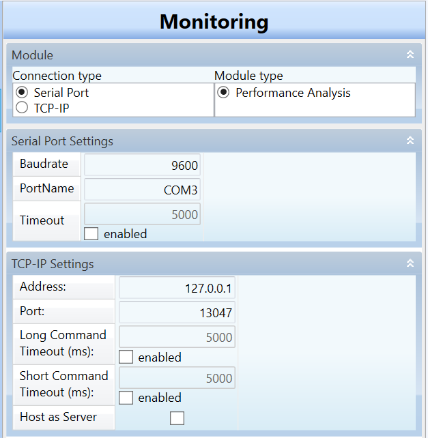
To connect the analyzer to a target or another simulation environment the right module has to be selected in the settings of analyzer. To reach this settings view: Ribbon-Tab: General -&gt; Settings -&gt; Monitoring -&gt; Module or Ribbon-Tab: Online -&gt; Select Com Type Select the desired communication type and as module Scene Analyzer.

To establish the connection click the Button start at Ribbon-Tab Online.

####   
**Offline Performance Data Analysis**

Once a performance log is opened via Open menu of Analyzer, features in the "Performance Log" tab of Analyzer are enabled.

Please refer to section Measurements for further details.

####   
**Usage of different Candera mechanisms**

##### <a class="anchor" id="bkmrk--7"></a>Offline Performance Data Analysis

The Analyzer supports different concepts of rendering. The two main concepts are a cyclic rendering concept and the render wakeup mechanism of courier applications. Last one triggers rendering only when graphical changes happened. Both of these concepts work with Analyzer, but there are some logical restrictions. For example: A cyclic rendering mode sends updates to the Analyzer on a regular base. When these updates stop for a certain time, the Analyzer can assume that the communication has troubles. The render wakeup mechanism on the other hand produces these update stops intentionally.

Therefore, handling render wakeup mechanism differs from cyclic concept: All updates and requests are only handled when rendering is triggered. Timeouts should be disabled which disables the earlier mentioned communication trouble checking. Enabling timeouts do not necessarily disconnect the communication but disables some features(e.g. pause) until the application triggers rendering process again. This includes KPI-Updates and Pause requests. Pressing pause results in a waiting phase until the rendering process is triggered. The pause mode works as usual.

####   
**Multithreaded performance logs**

Performance recording supports multithreaded recordings. To enable this feature, use the recordings/recorder equal to the single threaded variant. There is no additional code needed by default. However, there are some restrictions and helpful macros which should be kept in mind to avoid unwanted behavior. Normally, these are not required to use this feature. They should be used when displayed results in the analyzer are not expected.

##### <a class="anchor" id="bkmrk--8"></a>Synchronization of threads

It is advisable to synchronize the threads when writing the data from the performance log buffer to any destination (e.g. filedump, memorydump, data streaming). This prevents unstable data within the buffer as the other threads continue running even in the paused mode of an online connection with the analyzer tool. There are two solutions to synchronize the threads.

```
#include <Candera/System/Monitor/PerfMonPublicIF.h>
…
#define CANDERA_PERF_COLLECT_RECORDING_THREAD_SYNC_BARRIER
#define CANDERA_PERF_PRODUCE_RECORDING_THREAD_SYNC_BARRIER
```

The first macro should be used in the thread which dumps data. The macro MONITOR\_HANDLE\_PAUSED does that internally, so using the analyzer tool for a live connection does not require the call of the first macro. The second macro should be called in all the other threads which are using performance recordings. The second solution is to use a custom synchronization method of all threads.

<div class="contents" id="bkmrk-it-is-also-advised-t"><div class="contents"><div class="textblock"><dl class="note"><dt></dt><dd><p class="callout info">It is also advised to add the synchronization barrier outside of the top level recording of a thread. This prevents influences of nested recordings on the current dump but also on an additional dump – as the buffer will be cleared even if there are recordings which are not done recording yet.</p>

</dd></dl></div></div></div>##### <a class="anchor" id="bkmrk--9"></a>Restrictions

Some of the recorder types have to store information of a recording temporary until the recording itself has been completed. It is advisable to use own recorder (own ID and/or name) for each thread. Typical issues can occur with AsyncTimingRecorder and cumulative recorders as their data may be written and corrupted by multiple threads.

<div class="contents" id="bkmrk-in-most-cases-using-"><div class="textblock"><dl class="note"><dt></dt><dd><p class="callout info">In most cases using one recorder in multiple threads will not produce issues but it is not guaranteed to do so.</p>

</dd></dl></div></div>

# Analysis

#### **Concept** 

##### <a class="anchor" id="bkmrk--21"></a>Analysis Concept

The analysis module allows the user to conduct experiments and thereby discover performance bottlenecks.

These experiments can be performed on the host in a simulation or on the target.   
During an experiment, the host and target have to be connected. Currently, Analyzer only supports a connection via TCP/IP and Serial Port.

####   
**Preparations for Analysis** 

#### <a class="anchor" id="bkmrk--22"></a>Build Candera with Monitor enabled

[Candera](http://dev.doc.cgistudio.at/APILINK/namespace_candera.html "[DataBinding_RefTypeSample]"), as well as the application you are writing, have to be configured via CMake. Point CMake to the source directory of your application and indicate a directory for binary generation. Then fire up configuration. For further instructions see <span style="color: rgb(230, 126, 35);">[Establishing connection](#bkmrk-establishing-a-conne)</span>.

For configuration of CGI Monitor for a binary [Candera](http://dev.doc.cgistudio.at/APILINK/namespace_candera.html "[DataBinding_RefTypeSample]") distribution, see section 0.

<div class="contents" id="bkmrk-"><div class="contents"><div class="textblock">  
</div></div></div>#### <a class="anchor" id="bkmrk--23"></a>Provide CPU and/or GPU load

In order to display a trend with key performance indicators (CPU load, GPU load, frame rate) on Linux, the proc file system has to be mounted.

This can be accomplished (if not already mounted) by adjusting / adding the corresponding entry under /etc/mtab or mounting the proc file system by hand with the following command:

```
mount /proc
```

CPU and GPU information have to be provided by drivers / kernel modules and are thus not available on every (Linux) platform.

<div class="contents" id="bkmrk--0"><div class="contents"><div class="textblock">  
</div></div></div>#### <a class="anchor" id="bkmrk--24"></a>Provide communication infrastructure

[Candera](http://dev.doc.cgistudio.at/APILINK/namespace_candera.html "[DataBinding_RefTypeSample]") is only pre-configured for communication with Analyzer, if you call the function Renderer::RenderAllCameras or Renderer2D::RenderAllCameras (or both).

Otherwise, you have to ensure, that

<div class="contents" id="bkmrk-connection-parameter"><div class="contents"><div class="textblock">- Connection parameters are set correctly
- A connection is established
- A [Candera](http://dev.doc.cgistudio.at/APILINK/namespace_candera.html "[DataBinding_RefTypeSample]") application can be paused by Analyzer

</div></div></div>##### <a class="anchor" id="bkmrk--25"></a>Setting connection parameters

Communication parameters can be set, if necessary, using the following macro:

```
#include <Candera/System/Monitor/MonitorPublicIf.h>
MONITOR_PORT_CONFIGURE(address, port)
```

<div class="contents" id="bkmrk-note%3A-this-macro-nam"><div class="contents"><div class="textblock"><div class="fragment">  
</div><dl class="note"><dd><p class="callout info">This macro name has changed with v3.2. Previous version were named MONITOR\_TCPIP\_CONFIGURE.</p>

</dd></dl></div></div></div>The standard Player for use with the tunnel application under Windows presents a dialog for setting communication parameters after the asset library to load has been chosen. The tunnel sample application delivered with [Candera](http://dev.doc.cgistudio.at/APILINK/namespace_candera.html "[DataBinding_RefTypeSample]") now takes two additional parameters for TCP/IP address and port or for Serial Communication baudrate and com port. This macro has to be used before either MONITOR\_TRYCONNECT() or MONITOR\_HANDLE\_PAUSED(), otherwise the standard configuration will still remain.

##### <a class="anchor" id="bkmrk--26"></a>Establishing a connection

A connection can be established explicitly, if necessary, from application code, by using the following macro

```
#include <Candera/System/Monitor/MonitorPublicIf.h>
MONITOR_TRYCONNECT()
```

##### <a class="anchor" id="bkmrk--27"></a>Enabling the pausing of a Candera application

For Analyzer to be able to pause your application and the key performance indicators to be updated, the following macro has to be called every time, the drawing of a new frame begins:

```
#include <Candera/System/Monitor/MonitorPublicIf.h>
MONITOR_HANDLE_PAUSED()
```

####   
**Connecting with a Candera application** 

The procedure for setting up a connection between host and target is as follows:

<div class="contents" id="bkmrk-start-analyzer-confi"><div class="contents"><div class="textblock">1. Start Analyzer
2. Configure the communication server
3. Start the server via the Server Ribbon Group on the Online Ribbon Tab
4. Start the [Candera](http://dev.doc.cgistudio.at/APILINK/namespace_candera.html "[DataBinding_RefTypeSample]") application, it will try to connect to the pre-configured port and IP-address

</div></div></div>Configuration, starting, and stopping of the analysis server are triggered from the server ribbon group as depicted in the following figure.

<div drawio-diagram="1231"><img src="https://doc316en.candera.eu/uploads/images/drawio/2023-02/drawing-4-1676525023.png" alt=""/></div>

<div class="contents" id="bkmrk--2"><div class="contents"><div class="textblock">  
</div></div></div>Upon successful connection between Analyzer and the [Candera](http://dev.doc.cgistudio.at/APILINK/namespace_candera.html "[DataBinding_RefTypeSample]") application, the [Candera](http://dev.doc.cgistudio.at/APILINK/namespace_candera.html "[DataBinding_RefTypeSample]") application is in Running Mode. A successful connection is indicated by the status bar. The server state is displayed as Connected and the application state as "Running".

##### <a class="anchor" id="bkmrk--29"></a>Configuration

The communication server is configured using a configuration dialog accessed through the "Configure" button on the Server Ribbon Group. Figure 20 shows the configuration dialog for TCP/IP connections.

<div class="contents" id="bkmrk-ip-address-and-port%2C"><div class="contents"><div class="textblock"><dl class="note"><dt></dt><dd><p class="callout info">IP-address and port, where Analyzer should listen for incoming connection requests have to be set.</p>

</dd></dl></div></div></div><div drawio-diagram="5305"><img src="https://doc316en.candera.eu/uploads/images/drawio/2024-02/drawing-5-1708678414.png" alt=""/></div>

<div class="contents" id="bkmrk--4"><div class="contents"><div class="textblock">  
</div></div></div>Timeouts can be set in order to prevent the user interface from freezing indefinitely if the communication fails. Disabling these timeouts completely can lead to freezes and communication failures depending on application type, communication type and stability of connection.

####   
**Analysis Views** 

##### **Trend View** 

The Trend View shows successively recorded key performance indicators such as

<div class="contents" id="bkmrk-cpu-load-%28if-availab"><div class="contents"><div class="textblock">- CPU load (if available)
- GPU load (if available)
- Frame Rate

</div></div></div>It can be displayed via the View Ribbon Group of the Online Ribbon Tab.

<div drawio-diagram="1233"><img src="https://doc316en.candera.eu/uploads/images/drawio/2023-02/drawing-4-1676525106.png" alt=""/></div>

<div class="contents" id="bkmrk--6"><div class="contents"><div class="textblock">  
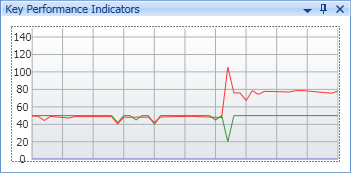
</div></div></div>The following shows a Trend View for a host simulation. The color assignment for the performance indicators is currently fixed and as follows:

<div class="contents" id="bkmrk-frame-rate-%28red%29-cpu"><div class="contents"><div class="contents"><div class="textblock">- Frame Rate (red)
- CPU load (green)
- GPU load (blue)

</div></div></div></div><div drawio-diagram="1234"><img src="https://doc316en.candera.eu/uploads/images/drawio/2023-02/drawing-4-1676525119.png" alt=""/></div>

<div class="contents" id="bkmrk--8"><div class="contents"><div class="textblock">  
</div></div></div>Mouse over the Trend View shows a clear button which resets the view.

Right-clicking the Trend View opens a context menu for

<div class="contents" id="bkmrk-closing-it-and-displ"><div class="contents"><div class="textblock">- closing it and
- displaying it always on top of every other window.

</div></div></div><div class="contents" id="bkmrk-gpu-load-availabilit"><div class="contents"><div class="textblock"><dl class="note"><dd><p class="callout info">GPU load availability is dependent on device capabilities.</p>

</dd></dl></div></div></div>The settings menu also provides settings for trends:

<div drawio-diagram="1236"><img src="https://doc316en.candera.eu/uploads/images/drawio/2023-02/drawing-4-1676525160.png" alt=""/></div>

<div class="contents" id="bkmrk--10"><div class="contents"><div class="textblock">  
</div></div></div>These settings allow to set the update rate and the history length of trends. IT is possible to change these values on the fly without restarting, pausing or changing the communication

#####   
**Scene Graph View** 

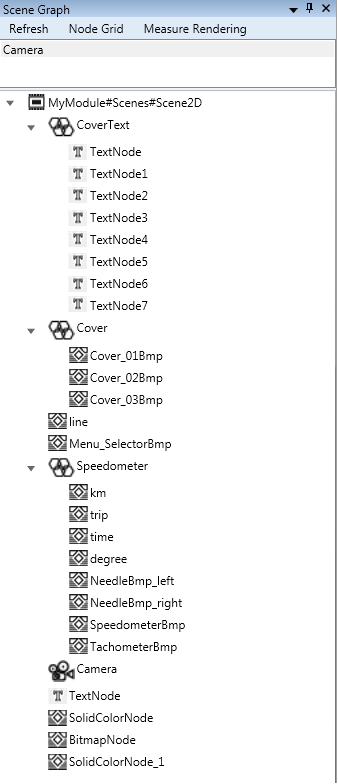
The Scene Graph View allows analysis of the scene graph during paused mode.

<div drawio-diagram="1238"><img src="https://doc316en.candera.eu/uploads/images/drawio/2023-02/drawing-4-1676525192.png" alt=""/></div>

<div class="contents" id="bkmrk--12"><div class="contents"><div class="textblock">  
</div></div></div>This view is divided vertically by a splitter into two sections:

<div class="contents" id="bkmrk-a-camera-list-on-top"><div class="contents"><div class="textblock">- A camera list on top and
- A tree view of a scene graph below.

</div></div></div>The tree view shows the scene graph associated with the selected camera in the camera list.

The following commands are available via a toolbar on top of the Scene Graph View:

**Refresh:**

<div class="contents" id="bkmrk-this-command-is-alwa"><div class="contents"><div class="textblock">- This command is always available in paused mode.
- Fetches the scene graphs from the [Candera](http://dev.doc.cgistudio.at/APILINK/namespace_candera.html "[DataBinding_RefTypeSample]") application and displays it. Node expansion and selected nodes are preserved.

</div></div></div>**Node Grid:**

<div class="contents" id="bkmrk-this-command-is-avai"><div class="contents"><div class="textblock">- This command is available in paused mode, if a camera was selected from the camera list.
- Displays all information transferred for the scene graph of the selected camera in a grid.

</div></div></div>**Measure Rendering:**

<div class="contents" id="bkmrk-this-command-is-avai-0"><div class="contents"><div class="textblock">- This command is available in paused mode, if a camera was selected from the camera list.
- Measures the rendering times of individual nodes and displays the render times along with static scene graph information in a grid

</div></div></div>The properties of a selected node are displayed in the <span style="color: rgb(230, 126, 35);">[Properties View](#bkmrk-properties-view%C2%A0)</span>.

#####   
**Properties View** 

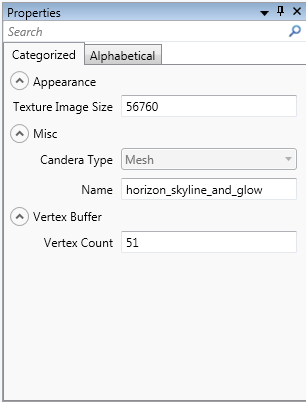
Depending on the scene graph node selected in the Scene Graph View, different properties are displayed.

For each node, the following properties are displayed:

<div class="contents" id="bkmrk-name%3A-the-name-of-th"><div class="contents"><div class="textblock">- **Name:** The name of the node, if available, a blank field otherwise
- **[Candera](http://dev.doc.cgistudio.at/APILINK/namespace_candera.html "[DataBinding_RefTypeSample]") Type:** The type of the node (e.g. Mesh or Group)

</div></div></div><div drawio-diagram="1243"><img src="https://doc316en.candera.eu/uploads/images/drawio/2023-02/drawing-4-1676525374.png" alt=""/></div>

<div class="contents" id="bkmrk--14"><div class="textblock">  
</div></div>#### **Guards** 

Guards are a means to switch a [Candera](http://dev.doc.cgistudio.at/APILINK/namespace_candera.html "[DataBinding_RefTypeSample]") application from running to paused mode.

We differentiate between two flavors of guards:

<div class="contents" id="bkmrk-conditional-guards-u"><div class="contents"><div class="textblock">- Conditional Guards
- Unconditional Guards

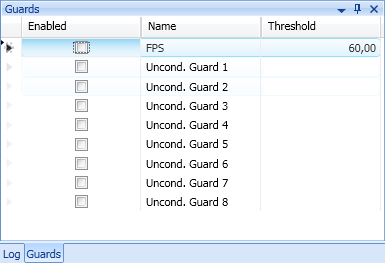
</div></div></div>Conditional guards are triggered, when a condition is met. Currently, only one conditional guard (based on measured frames per second) is supported. If the measured frames per second fall below a specified value, the guard is triggered, if it has been enabled, and the [Candera](http://dev.doc.cgistudio.at/APILINK/namespace_candera.html "[DataBinding_RefTypeSample]") application enters the paused mode.

Unconditional guards can be set in application code via the use of the following macros:

```
#include <Candera/System/Monitor/MonitorPublicIf.h>
MONITOR_FORCE_PAUSED(groupId)
```

Guards are combined in guard groups. Each guard group has a unique id (the guard group ids are defined in the include file MonitorTypes.h).

<div drawio-diagram="1246"><img src="https://doc316en.candera.eu/uploads/images/drawio/2023-02/drawing-4-1676525406.png" alt=""/></div>

<div class="contents" id="bkmrk--16"><div class="contents"><div class="textblock">  
</div></div></div>All guards can be en- and disabled. Additionally, the number of frames per second can be set for a FPS guard.

####   
**Performance Log Transfer** 

During an active connection to a [Candera](http://dev.doc.cgistudio.at/APILINK/namespace_candera.html "[DataBinding_RefTypeSample]") application, a performance log can be transferred from the target to the host via the communication channel used.

There are two flavors of performance log transfer:

<div class="contents" id="bkmrk-recording-until-the-"><div class="contents"><div class="textblock">- Recording until the recording buffer is full and explicit transfer of the buffer content
- Continuous streaming of performance log data to a specified file

</div></div></div>##### <a class="anchor" id="bkmrk--37"></a>Single Buffer Recording and Transfer

Caution has to be taken to use only one of the following means of performance log recording

<div class="contents" id="bkmrk-record-to-file-on-de"><div class="contents"><div class="textblock">- Record to file on device
- Record to memory buffer on device

</div></div></div>If both flavors of recording are enabled, unpredictable effects may occur.

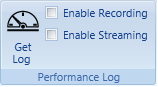
Recording to memory buffer is enabled via the Enable Recording checkbox of the Performance Log Ribbon Group.

<div drawio-diagram="1248"><img src="https://doc316en.candera.eu/uploads/images/drawio/2023-02/drawing-4-1676525450.png" alt=""/></div>

<div class="contents" id="bkmrk--18"><div class="contents"><div class="textblock">  
</div></div></div>After the memory buffer has been filled (approx. 1 sec), the buffer contents can be transferred to the host and stored in a file by clicking the "Get Log" button, also located in the Performance Log Ribbon Group.

##### <a class="anchor" id="bkmrk--39"></a>Performance Log Streaming

Performance log streaming is the continuous recording and transfer for performance log data from a [Candera](http://dev.doc.cgistudio.at/APILINK/namespace_candera.html "[DataBinding_RefTypeSample]") application to Analyzer.   
Streaming is enabled by first enabling recording via the Performance Log Ribbon Group and then enabling streaming via the "Enable Streaming" checkbox. A storage location for the performance log data (file) is asked.

After provision of this information, performance log data is continuously streamed from target to host and appended to the specified file.

####   
**Global Experiments** 

Experiments allow the user to locate performance bottlenecks by intervening in the rendering process. By targeted change of rendering parameters, conclusions about the origins of performance issues can be drawn.

There are three different groups of experiments:

<div class="contents" id="bkmrk-3d-experiments-2d-ex"><div class="contents"><div class="textblock">- 3D experiments
- 2D experiments
- Custom experiments

</div></div></div>##### <a class="anchor" id="bkmrk--40"></a>2D/3D Experiments

The following experiments are available:

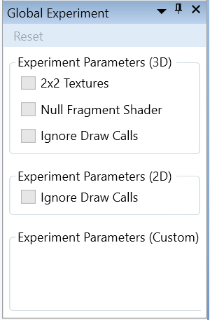
<div class="contents" id="bkmrk-2x2-textures-%283d-onl"><div class="contents"><div class="textblock">- 2x2 textures (3D only)
- Null Fragment Shader (3D only)
- Ignore Draw Calls

</div></div></div>The following figure shows the dialog for setting experiments. Currently, experiments can only be en- or disabled in Paused Mode.

<div drawio-diagram="5306"><img src="https://doc316en.candera.eu/uploads/images/drawio/2024-02/drawing-5-1708678756.png" alt=""/></div>

<div class="contents" id="bkmrk--20"><div class="contents"><div class="textblock">  
</div></div></div>##### <a class="anchor" id="bkmrk--42"></a>Using 2x2 textures

All textures are replaces with a 2x2 texture using a chess pattern.   
If the frame rate rises significantly after enabling 2x2 textures, there are likely too big textures in use.

##### <a class="anchor" id="bkmrk--43"></a>Null Fragment Shader Program

All shader programs are replaces with a default shader program whose fragment shader always produces the color red.   
If the frame rate rises significantly after enabling the null fragment shader, fragment shader may be to complex.

##### <a class="anchor" id="bkmrk--44"></a>Ignore Draw Calls

All draw calls are ignored, thereby simulating an infinitely fast GPU. If the frame rate does not rise significantly, the problem may be CPU-bound.

##### <a class="anchor" id="bkmrk--45"></a>Custom Experiments

Custom experiments are universally usable experiments. In general it is a table of functions which have a parameter (enable/disable). The analyzer can trigger function calls on these specified functions. An experiment state is false/disabled per default.

##### <a class="anchor" id="bkmrk--46"></a>Custom Experiments - Target side:

To use this feature, the following flag has to be set:

```
// Enables custom experiments
#define CANDERA_MONITOR_CUSTOM_EXPERIMENTS
```

This flag can be set within code when it were not enabled by cmake configuration.

<div class="contents" id="bkmrk-using-this-flag-requ"><div class="contents"><div class="textblock"><dl class="note"><dt></dt><dd><p class="callout info">Using this flag requires init-Call (next step). Compiler produces error without this init-Call.</p>

</dd></dl></div></div></div>The following sample code snippet has to be used in order to register a function as experiment:

```
//Adds macros for global experiments
#include <Candera/System/Monitor/GlobalExperimentPublicIF.h>
… 
// Function which can be triggered by analyzer
void SampleFunction(bool flag); 

// Initializes list – has to be outside of any namespace
//First param is amount of function pointer
//following parameters are function pointers
GLOBAL_EXPERIMENT_INIT_CUSTOM_LIST(1, SampleFunction)
```

The include adds the appropriate macros. To enable these custom experiments previously mentioned define has to be set.

<div class="contents" id="bkmrk-the-init-call-has-to"><div class="contents"><div class="contents"><div class="textblock"><dl class="note"><dd><p class="callout info">The Init-Call has to be placed outside of any namespace and function.</p>

</dd></dl></div></div></div></div>A callable function’s declaration is defined as:

```
void FunctionName(bool flag);
```

In general: A static function with no return value. The flag is set by analyzer. A function within namespaces and classes can be added but need full declaration. This function should never be called by custom code - otherwise undefined behavior. The next point explains a way to indirectly call such a function.

Calling a function pointer by target application  
If it is required to call a registered function pointer, use the following macro:

```
GLOBAL_EXPERIMENT_CALL_CUSTOM_EXPERIMENT(fct_ptr, value);
```

##### <a class="anchor" id="bkmrk--47"></a>Global Experiments - Analyzer:

The analyzer provides a view for global experiments. It contains three different areas for 2D, 3D and custom experiments. To enable or disable an experiment toggle the checkbox. Custom experiments are listed in the same order as they were added to list on target side (see <span style="color: rgb(230, 126, 35);">[Custom Experiments - Target side:](#bkmrk-custom-experiments--)</span> GLOBAL\_EXPERIMENT\_INIT\_CUSTOM\_LIST). If the list is wrong or not present, pause the application to update the experiments list.

Additionally it provides a reset button which is used to disable all experiments.

# Memory Analyzer Overview

# Overview

Administrating memory is a very important part of developments for embedded devices. Therefore CGI Studio contains an own memory management to provide an abstraction layer and a higher controllability of memory behavior.   
The MemoryPool-Analyzer module extends the memory pool analyzing possibilities. It traces and displays the allocation behavior of an application. Furthermore it helps finding memory issues.

<div class="contents" id="bkmrk-knowledge-about-the-"><div class="contents"><div class="textblock"><dl class="note"><dt></dt><dd><p class="callout info">Knowledge about the functionality of MemoryPools memory management system may be of advantage</p>

</dd></dl></div></div></div>#### <a class="anchor" id="bkmrk-"></a>MemoryPool Analyzer feature list

The Analyzer traces and analyzes allocation behavior of the MemoryPool memory management. It supports: <span style="color: rgb(230, 126, 35);">[Obtaining data](https://doc316en.candera.eu/books/analyzer/page/obtaining-data "Obtaining data")</span> , <span style="color: rgb(230, 126, 35);">[Data presentation](https://doc316en.candera.eu/books/analyzer/page/data-presentation "Data presentation")</span> &amp; <span style="color: rgb(230, 126, 35);">[Analyzing the data](https://doc316en.candera.eu/books/analyzer/page/analyzing-the-data "Analyzing the data")</span>

# Overview of the graphical user interface

##### <a class="anchor" id="bkmrk--1"></a>This section contains:

The MemoryPool-Analyzer module extends the tab region of the Analyzer ribbon area.

<div drawio-diagram="1260"><img src="https://doc316en.candera.eu/uploads/images/drawio/2023-02/drawing-4-1676525983.png" alt=""/></div>

<div class="contents" id="bkmrk--0"><div class="contents"><div class="textblock">  
</div></div></div>The tab is split in three different groups:

<div class="contents" id="bkmrk-view%3A-filter-and-sel"><div class="textblock">- **View:** Filter and selection of a subset of traced data 
    - **Memory Pool Explorer:**   
        Shows the hierarchical memory structure. Content of review will be changed based on this selection. <dl class="see"><dt>**See also:**</dt><dd><span style="color: rgb(230, 126, 35);">[Memory Pool Explorer](https://doc316en.candera.eu/link/285#bkmrk-memory-pool-explorer)</span></dd></dl>
    - **Global Time Slider:**   
        This time slider provides access to memory snapshots. Most features are bound to this snapshot. <dl class="see"><dt>**See also:**</dt><dd><span style="color: rgb(230, 126, 35);">[Global Time Slider](https://doc316en.candera.eu/link/285#bkmrk-global-time-slider)</span></dd></dl>
    - **Memory Pool Properties:**   
        Provides general Properties of selected nodes (Memory Pool Explorer) at the specified memory snapshot. <dl class="see"><dt>**See also:**</dt><dd><span style="color: rgb(230, 126, 35);">[Memory Properties](https://doc316en.candera.eu/link/285#bkmrk-memory-properties%C2%A0)</span></dd></dl>
- **Reviews:** Access to statistics and analysis views 
    - **Memory Pool Charts:**   
        Shows memory trends over time and comparisons between different nodes. <dl class="see"><dt>**See also:**</dt><dd><span style="color: rgb(230, 126, 35);">[Memory Bar Charts](https://doc316en.candera.eu/link/285#bkmrk-memory-bar-charts)</span></dd><dd><span style="color: rgb(230, 126, 35);">[Memory Over Time Chart](https://doc316en.candera.eu/link/285#bkmrk-%C2%A0memory-over-time-ch)</span></dd></dl>
    - **Bad Smells:**   
        Provides different analysis tools to identify memory issues. <dl class="see"><dt>**See also:**</dt><dd><span style="color: rgb(230, 126, 35);">[Bad Smells](https://doc316en.candera.eu/link/286#bkmrk-bad-smells%C2%A0)</span></dd></dl>
    - **Memory Pool Statistics:**   
        Shows all traced information within a table. <dl class="see"><dt>**See also:**</dt><dd><span style="color: rgb(230, 126, 35);">[Memory Pool Statistics](https://doc316en.candera.eu/link/285#bkmrk-memory-pool-statisti)</span></dd></dl>
    - **Info List:**   
        Shows all logged messages. <dl class="see"><dt>**See also:**</dt><dd><span style="color: rgb(230, 126, 35);">[Information list](https://doc316en.candera.eu/link/285#bkmrk-information-list%C2%A0)</span></dd></dl>
- **MemoryPools:** Contains general content to improve the usability 
    - **Memory Settings:**   
        Provides several settings to configure the module. <dl class="see"><dt>**See also:**</dt><dd><span style="color: rgb(230, 126, 35);">[Settings](https://doc316en.candera.eu/link/286#bkmrk-settings%C2%A0)</span></dd></dl>
    - **File Editor:**   
        The Analyzer supports opening filepaths and present these files within the file editor. <dl class="see"><dt>**See also:**</dt><dd><span style="color: rgb(230, 126, 35);">[File Editor](https://doc316en.candera.eu/link/286#bkmrk-file-editor%C2%A0)</span></dd></dl>
    - **Refresh:**   
        Reloads dataset into views. If some errors in views occurred or dataset is not loaded properly, this button will reload these data and try to fix erroneous views.

</div></div>

# Obtaining data

#### **Traceable data: Which data will be traced?** 

##### <a class="anchor" id="bkmrk--2"></a>Allocating and releasing memory

The most important part of this Analyzer module is tracing all allocation and free calls within the code. That includes normal allocation/free calls as well as allocations in the Backing Heap.

The used terminology within the Analyzer is:

<div class="contents" id="bkmrk-allocate-memory-%3C-%3E-"><div class="contents"><div class="textblock">- Allocate memory &lt;-&gt; Alloc
- Free memory &lt;-&gt; Free
- Allocate in Backing Heap &lt;-&gt; Create
- Free Backing Heap Space &lt;-&gt; Destroy

</div></div></div>##### <a class="anchor" id="bkmrk--3"></a>Informational data

<div class="contents" id="bkmrk-this-feature-is-not-"><div class="contents"><div class="textblock"><dl class="note"><dt></dt><dd><p class="callout info">This feature is not added to a public interface yet.</p>

</dd></dl></div></div></div>Additional to these four existing types are several information types.  
These informations are used to provide more information and are generally used as orientation and filter helpers.

List of information types:

<div class="contents" id="bkmrk-allocation-failed-me"><div class="contents"><div class="textblock">- Allocation failed message: Contains information of the failed request
- Warning message
- Error message - Possible types: textual message or error code
- Info message: Supports different priority levels additional to the message
- Start and end marker: Defines a named time range

</div></div></div>##### <a class="anchor" id="bkmrk--4"></a>Start and end marker

These marker define a specified timespan within application runtime.   
Example: Encapsulate the render loop. Based on these markers it is easy to find out which memory changes happened every single loop iteration.

#### **Retrieving data** 

##### <a class="anchor" id="bkmrk--5"></a>Binary memory logging

The standard way to log memory changes is to enable it with CMake.  
To enabled it you have to complete the following steps:

<div class="contents" id="bkmrk-enable-memorypools-f"><div class="contents"><div class="textblock">- Enable MemoryPools ```
    <a class="code" href="http://dev.doc.cgistudio.at/APILINK/group___f_e_a_t_s_t_d___c_o_n_f_i_g.html#ga6e3f7a95a0d06b38bb0c255dd80ecb3a">FEATSTD_MEMORYPOOL_ENABLED</a> true
    ```
- Enable monitoring ```
    <a class="code" href="http://dev.doc.cgistudio.at/APILINK/group___f_e_a_t_s_t_d___c_o_n_f_i_g.html#gaa5831e2f6fa8672573f44659e5208a0d">FEATSTD_MONITOR_ENABLED</a> true
    ```
- Enable memory binary logging ```
    MONITOR_MEMORYPOOL_BINARY_LOGGING_ENABLED true
    ```

</div></div></div>Optional:

<div class="contents" id="bkmrk-change-filename-moni"><div class="contents"><div class="textblock">- Change filename ```
    MONITOR_MEMORYPOOL_BINARY_LOGGING_FILENAME "filename.membin"
    ```

</div></div></div><div class="contents" id="bkmrk-only-logging-into-a-"><div class="contents"><div class="textblock"><dl class="note"><dd><p class="callout info">Only logging into a file is currently supported. Turning off Performance Recording whilst logging memory changes is currently not supported yet. Using TCP/IP or Serial without an established connection (and therefore Performance Recording is ignored) is working though.</p>

</dd></dl></div></div></div>##### <a class="anchor" id="bkmrk--6"></a>Textual memory logging

It is possible to load a trace-log of your Logger into the Analyzer. There are a few required steps to make it work.

<div class="contents" id="bkmrk-the-logger-has-to-be"><div class="textblock">- The logger has to be enabled
- The messages are sent as DEBUG messages. So the logging level has to be DEBUG as minimum. ```
     <a class="code" href="http://dev.doc.cgistudio.at/APILINK/group___f_e_a_t_s_t_d___d_i_a_g_n_o_s_t_i_c_s.html#gaed9977d4815267bd05e7dcee49f94f4b">FEATSTD_LOG_SET_LOG_LEVEL</a>(<a class="code" href="http://dev.doc.cgistudio.at/APILINK/group___f_e_a_t_s_t_d___d_i_a_g_n_o_s_t_i_c_s.html#ggad2cbc908487f2a3b4340020c0f69bda0af5dfc3720ca935220d7c86cf1bb2aa27" title="Debug.">Debug</a>);
    ```
    
    <dl class="note"><dd><p class="callout info">Set the log level as soon as possible. All allocations before will not be traced, this also includes the memory pool preinitialization.</p>
    
    </dd></dl>
- The messages have to keep their default format: ```
    // sample for heap alloc
    0000000.025 [0x00000000] DEBUG FeatStdMemoryManagement FeatStdDefaultMemoryPool(0) heap alloc 0E2A93D0(24:P)
    // sample for alloc memory
    0000000.026 [0x00000000] DEBUG FeatStdMemoryManagement \featstd\src\FeatStd/Container/Vector.h(696): FeatStdDefaultMemoryPool(0) alloc 0E2A93E0 8(24:P)
    // sample for free memory
    0000000.027 [0x00000000] DEBUG FeatStdMemoryManagement \featstd\src\FeatStd/Container/Vector.h(696): FeatStdDefaultMemoryPool(0) free 0E2A93E0 8(24:P)
    // sample for heap free
    0000000.028 [0x00000000] DEBUG FeatStdMemoryManagement FeatStdDefaultMemoryPool(0) heap free 0E2A93D0(24:P)
    ```
    
    <dl class="note"><dd><p class="callout info">CgiAppLogger replaces the default logger and changes the format for DEBUG messages.</p>
    
    </dd></dl>
- To trace all possible data, it is important to create the LogAppender before initializing memory pools and destroy it afterwards.
- The file extension for these files has to be '\*.memlog'

</div></div><div class="contents" id="bkmrk-all-the-other-messag"><div class="textblock"><dl class="note"><dd><p class="callout info">All the other message types: <span style="color: rgb(230, 126, 35);">[info, warning, error, start/end marker](#bkmrk-traceable-data%3A-whic-0)</span> are not available when using these textual logs.</p>

</dd></dl></div></div>#### **Loading data** 

All logfiles can be loaded by clicking the application menu button -&gt; open -&gt; Open Memory-Log or by Drag'n'Drop.  
When loading a binary log file, a loading window will open after preanalyzing the content of the log file.

<div drawio-diagram="2983"><img src="https://doc316en.candera.eu/uploads/images/drawio/2023-03/drawing-4-1677747175.png" alt=""/></div>

<div class="contents" id="bkmrk--0"><div class="contents"><div class="textblock">  
</div></div></div>This window gives information about the logfile and allows to prefilter the dataset.  
It is possible to:

<div class="contents" id="bkmrk-disable-threads-disa"><div class="textblock">- Disable threads
- Disable memory pools
- Set a time range based on all recorded time marker. Use Drag'n'Drop to place a time marker on 'Start' or 'End'.

</div></div><div class="contents" id="bkmrk-large-log-files-may-"><div class="textblock"><dl class="note"><dt><p class="callout info">Large log files may slow down the analyzer drastically. The MemoryPool-Analyzer settings contains a property to set a cap for maximum loaded entries</p>

</dt></dl></div></div><div class="contents" id="bkmrk--8"></div>

# Data presentation

#### **Term definitions** 

<div class="contents" id="bkmrk-node%3A-a-node-is-defi"><div class="textblock">- Node: A node is defined as an instance of MemoryPool such as a block, a bin, a MemoryPool and the program itself.
- Event: An event represents a happening which were recorded. Events can be all types of allocations and frees.
- System: One complete log including all events and nodes.
- Requested Size: Requested size defines the size a user tried to allocate.
- Used Size: Used size defines the size which was actually allocated by the MemoryPools.
- Total Size: Total size is the current size of a node within the backing heap.
- Delta: It is possible that memory changes can happen in a not measurable time depending on the time resolution. A delta is an additional indicator to order calls within the same timestamp.

</div></div><div class="contents" id="bkmrk-all-sizes-do-not-con"><div class="textblock"><dl class="note"><dd><p class="callout info">All sizes do NOT contain the overhead of header information. The sizes always refer to the actual buffer size which can be used by the application.</p>

</dd></dl></div></div>#### **How to select data** 

##### <a class="anchor" id="bkmrk--14"></a>Memory Pool Explorer

The Memory Pool Explorer is used to restrict certain views to a specific dataset. It filters nodewise.  
In many usecases the knowledge about a specific node is important.  
For example:

<div class="contents" id="bkmrk-how-much-memory-were"><div class="contents"><div class="textblock">- How much memory were allocated in total?
- How much memory were allocated per MemoryPool?
- What is the proportion between these two?
- What is the difference between two systems?
- ... The Memory Pool Explorer is the primary way to indicate which nodes have to be compared.

</div></div></div>The hierarchy of the explorer is:

<div class="contents" id="bkmrk-systems-memorypools-"><div class="contents"><div class="textblock">- Systems 
    - MemoryPools 
        - Bins 
            - Blocks

</div></div></div>In most cases Systems and MemoryPools are enough to give a rough understanding how two nodes do relate.  
However, sometimes it is also important to understand how specific bins or even blocks (addresses) are used.  
Therefore all available nodes can be selected individually.   
Searching for a specific address can be quite troublesome, so a search bar for nodes exists to make the finding process easier.

<div drawio-diagram="1273"><img src="https://doc316en.candera.eu/uploads/images/drawio/2023-02/drawing-4-1676526654.png" alt=""/></div>

<div class="contents" id="bkmrk--0"><div class="contents"><div class="textblock">  
</div></div></div>##### <a class="anchor" id="bkmrk--16"></a>Global Time Slider

The Global Time Slider provides a slider with integrated zoom bar. The slider defines the current system time of which you may want to get further information.  
To go to the first occurring time or the very last entry within the trace, you may click on one of the two buttons at left and right side of slider.

At some time it is important to have a memory snapshot at a given time. The slider is used to select the required time.

<div drawio-diagram="1274"><img src="https://doc316en.candera.eu/uploads/images/drawio/2023-02/drawing-4-1676526683.png" alt=""/></div>

#### **Memory Properties** 

The memory pool properties view gives a short overview of currently selected nodes.  
The reference time for any information provided by the property list is based on the global time slider and its time value.

The properties are divided into three categories:

<div class="contents" id="bkmrk-event%3A-shows-the-ver"><div class="contents"><div class="textblock">- Event: Shows the very last event happened to the selected node(s) and its detailed information.
- Misc: Gives a brief overview of current selected nodes and statistics.
- Size: Shows information about the three size values: requested size, used size and total size. Additionally, information about the maximum up until the set global time of each size is given.

</div></div></div><div drawio-diagram="1275"><img src="https://doc316en.candera.eu/uploads/images/drawio/2023-02/drawing-4-1676526721.png" alt=""/></div>

<div class="contents" id="bkmrk--4"></div>#### **Memory Pool Statistics** 

The memory pool statistics gives a detailed information about all events occurred on the selected nodes and sub nodes. Additionally the current size related values are shown.

Each node contains two different types of table: A content table and an event table.

The content table gives information about:

<div class="contents" id="bkmrk-name-of-node-amount-"><div class="contents"><div class="textblock">- Name of node
- Amount of container: How many nodes does this container have?
- Total size
- Used size
- requested size
- usage of total size: How much size is in use compared to total size in percentage
- usage over time: how long is a node or one of his sub nodes in use compared to total length of time.
- Maximum of requested size until global time selected by slider.
- Maximum of used size until global time selected by slider.
- Maximum of total size until global time selected by slider.

</div></div></div>The event table gives information about:

<div class="contents" id="bkmrk-the-time-when-an-eve"><div class="contents"><div class="textblock">- The time when an event occurs
- The delta time of event. Sometimes more than one event occurs at the same time. To create a chronological order a second time is base is created. The second time base is called delta.
- Pool name in which the event occurs.
- Bin number in which the event occurs.
- Address of block which raises the event.
- Type of event.
- Requested size: A creation sets the block size which was created; an allocation sets size of user request. Otherwise its 0.
- Permanent: Permanent flag of creation or allocation. Destructions and frees do not have this flag, so it’s always not set.
- Filename: Shows location where event occurred. Creations and destructions do not have a location. Clicking on a filename opens the specific file in a file editor.

</div></div></div><div drawio-diagram="1276"><img src="https://doc316en.candera.eu/uploads/images/drawio/2023-02/drawing-4-1676526754.png" alt=""/></div>

<div class="contents" id="bkmrk--6"></div>#### **Memory Bar Charts**

Accessing the Memory Bar Charts is done by clicking on Memory Pool Charts on the Analyzer ribbon tab and selecting 'Bar Chart Statistics' on the drop down menu.

The Memory Bar Charts are used to directly compare different nodes at a specified time.

There are a total of three different values which can be shown within a single bar chart simultaneously. Any value can be set independent from the others.  
The first value always refers to a selected node. The others can show information of the selected node, Information of the node which contains the selected node or a specific reference to a node. When last option is chosen every selected node has the specified node as second reference.

Current comparison values are:

<div class="contents" id="bkmrk-used-size-requested-"><div class="contents"><div class="textblock">- Used Size
- Requested size
- Total Size
- Usage over time
- Maximum of requested size
- Maximum of used size
- Maximum of total size

</div></div></div>The third comparison value is activated when the checkbox is checked.  
Another option is to toggle the percentage mode. When this mode is active, relationship between node's value and its comparison value is shown in percentage.

<div drawio-diagram="1277"><img src="https://doc316en.candera.eu/uploads/images/drawio/2023-02/drawing-4-1676526788.png" alt=""/></div>

<div class="contents" id="bkmrk--9"></div>####   
**Memory Over Time Chart** 

Accessing the Memory Over Time Charts is done by clicking on Memory Pool Charts on the Analyzer ribbon tab and selecting 'Bar Chart Statistics' on the drop down menu.

This chart gives a visual overview of the memory behavior over time. All selected nodes are shown within this chart. Every selected node provides three different lines within this chart:

<div class="contents" id="bkmrk-requested-size-used-"><div class="contents"><div class="textblock">- Requested size
- Used size
- Total size

</div></div></div>All three of them can be disabled to concentrate on the currently most important graph. Within this chart is a vertical line which marks the time value selected by the slider.

<div drawio-diagram="1278"><img src="https://doc316en.candera.eu/uploads/images/drawio/2023-02/drawing-4-1676526816.png" alt=""/></div>

<div class="contents" id="bkmrk--11"></div>#### **Information list**   


The info list lists all occurred notification events. A notification event can be an info message, warning or error.

There are three types of info messages:

<div class="contents" id="bkmrk-start-key-message%3A-s"><div class="contents"><div class="textblock">- Start key message: Sets a start point
- End key message: Sets an endpoint
- Information message

</div></div></div>A start key and its corresponding end key, both have to have the same name, are forming a group. An information message may have a priority level. The default priority is set to 0. All three types can be toggled on or off.

<div class="contents" id="bkmrk-see-also%3A-informatio"><div class="contents"><div class="textblock"><dl class="see"><dt>**See also:**</dt><dd><span style="color: rgb(230, 126, 35);">[Informational data](https://doc316en.candera.eu/link/282#bkmrk-informational-data)</span></dd></dl></div></div></div><div drawio-diagram="1279"><img src="https://doc316en.candera.eu/uploads/images/drawio/2023-02/drawing-4-1676526852.png" alt=""/></div>

# Analyzing the data

#### **Bad Smells** 

##### <a class="anchor" id="bkmrk--2"></a>Overview

The depth-first search analyze tools or 'Bad Smells' are tools to find abnormalities and lists several information about the currently loaded log trace.  
Most information is connected to event occurrence location. The word location in the following context references to this kind of location.  
Every tool can be started separately when clicking on rerun.   
An entry within the found entry list can be marked as false positive either by drag and drop to defined false positive area or by context menu.

##### <a class="anchor" id="bkmrk--3"></a>Path Allocation Count

The path allocation count lists all existing locations and its amount of allocations that happens at this location.  
Based on the total amount of allocation a percentage value is created.  
The summary gives information about how many locations hold more than the specified percentage threshold.  
To change this threshold go to Memory Settings and choose the tab of path allocation count.

##### <a class="anchor" id="bkmrk--4"></a>Reoccurring cluster

This tool searches for reoccurrences within the log trace. A cluster is defined as a location which is followed by one or more locations. The reoccurrence is defined by settings. When a location and its follow-ups are reoccurring over and over again, it is marked as a found entry.  
The settings provide several limitations.  
The maximum length of a cluster can be set to reduce calculation time.  
The minimum occurrences thresholds filter more data to concentrate on most reoccurring clusters.  
When a location is rarely in use, this location may always be marked as end of a cluster. This value of usage can also be specified.

##### <a class="anchor" id="bkmrk--5"></a>Memory hold per line

This tool gives an overview of the total allocation size of each location and a brief overview of which allocations were requested.  
It lists all information without thresholds because any information can be useful.

##### <a class="anchor" id="bkmrk--6"></a>Short allocation duration

This tool shows all allocations which may be freed shortly after this allocation. The time difference can be set within the settings.  
An additional summary shows all locations which hold more than a specified threshold of appearances in percentage. It also includes the amount of appearances.

##### <a class="anchor" id="bkmrk--7"></a>Memory leak detector

This tool searches for possible memory leaks. The accuracy is based on the input data. If entries are missing or the trace ends before entire shutdown, some allocations may have no corresponding free event. Filtering the dataset also affects the output. Filtering the data can be disabled in settings.

##### <a class="anchor" id="bkmrk--8"></a>Never used blocks

This tool searches for blocks which are created within the backing heap but are never used. This mainly happens when memory is preallocated but never used.

##### <a class="anchor" id="bkmrk--9"></a>Block creation after init

This tool searches for blocks which are created after the preallocation or initialization.

##### <a class="anchor" id="bkmrk--10"></a>Current Block Configuration

This tool gives a brief overview of blocks which were allocated in the backing heap. There are two different values. The first one defines the maximum block amount of a specific block size. And the second one specifies the amount of blocks which are used at the time of global time slider.

#### **File Editor** 

The file editor may be opened by clicking the menu button or when a highlighted filename or path is clicked.  
The editor provides basic syntax highlighting. Files can be altered and saved.

<div class="contents" id="bkmrk-when-altering-file%2C-"><div class="contents"><div class="textblock"><dl class="note"><dd><p class="callout info">When altering file, no syntax error check may be done.</p>

</dd><dd></dd></dl></div></div></div><div drawio-diagram="1287"><img src="https://doc316en.candera.eu/uploads/images/drawio/2023-02/drawing-4-1676527254.png" alt=""/></div>

<div class="textblock" id="bkmrk--0"></div><div class="textblock" id="bkmrk--1"></div>####   
**Settings** 

The memory settings contain all threshold and settings which can be set. There are currently three different types of settings:

<div class="contents" id="bkmrk-memory-settings-dept"><div class="contents"><div class="textblock">- Memory settings
- Depth-first search analyzing settings
- Filter settings

</div></div></div>Every settings type has two default settings:

<div class="contents" id="bkmrk-use-filtered-entries"><div class="contents"><div class="textblock">- Use filtered entries: When this flag is set currently selected filters are in use - shown dataset is removed to its selection.
- Enabled: Enables or disables the current settings. Depth-first search will not be done at load time when its enabled flag is not set but the bad smell startup is set.

</div></div></div>The memory settings change overall settings of memory to improve usability and performance:

<div class="contents" id="bkmrk-filter-data-while-lo"><div class="contents"><div class="textblock">- Filter data while loading: previously set filter are filtering data when trace is loaded. This reduces the amount of data which may be loaded and increases performance.  
    It also excludes unwanted information.
- Maximum loadable event entries: This value prevents the system to become irresponsible when too many entries are added. The value which should be set depends on the target system on which the program is running.
- Bad smell startup enable: Enables the calculation run of all depth-first searches after a dataset is loaded. This slow down the loading progress but you do not have to press the calculation button for every single tool and continually wait until the next tool is done with calculation.
- Line chart - Edges: When an event occurs like an allocation, the used memory does not increase like a continual signal. The increase may happen in an instance like a discrete signal. Therefore the usage over time chart is discrete. Each edge needs a second entry to be set. That results in a double amount of marker within the chart. Too many markers may slow down the system.
- Line chart - marker: Every Marker provides additional information about the current event happening at a specific position. If this information is not needed and the performance decreases drastically, it is recommended to disable the markers. Disabling the markers also change the visual impression of the chart. The detailed information is removed and the overview over the usage of time is increased.
- Line chart - resolution: The resolution affects the drawing of line within the chart. A higher value may ignore datasets when drawing the connecting line and increases performance.

</div></div></div>##### <a class="anchor" id="bkmrk--12"></a>Filter

Every filter type has specific flags which can be set like the enabled flag.  
Additionally, every filter type contains a list of all existing filter of its type.   
The time range filter is able to reduce the dataset to the selected time area.   
The time ranges are based on keynotes. Additional time ranges can be created by user, too.  
The thread filter filters all data of specific threads, processes or systems. If the thread name stays the same in two different traces, the system name and/or process name can be ignored. Only the thread names will be checked when filtering.

<div class="contents" id="bkmrk-normally%2C-pid-and-th"><div class="textblock"><dl class="note"><dd><p class="callout info">Normally, PID and thread IDs are given randomly by system. There is no guaranteed way to filter specific threads/processes away when loading new traces.</p>

</dd></dl></div></div>

# Frame Debugger

# Overview

<div class="header" id="bkmrk-"><div class="headertitle">  
</div></div>#### Frame Debugger

The CGI Studio Analyzer contains a Frame Debugger. This feature can be used to analyze the rendering process of [Candera](http://dev.doc.cgistudio.at/APILINK/namespace_candera.html "[DataBinding_RefTypeSample]") on a target device. It provides an overview about the composition of one frame (rendered nodes), shows detailed OpenGL information and adds the ability to capture the color, depth and stencil buffers.

##### <a class="anchor" id="bkmrk--0"></a>Requirements

<div class="contents" id="bkmrk-windows-host-running"><div class="contents"><div class="textblock">- Windows Host running CGI Analyzer
- Application 
    - Monitor and Frame Debugger enabled (CMake)
    - TCP/IP connection
    - Enough free RAM during execution on the target device to copy framebuffer contents.

</div></div></div>##### <a class="anchor" id="bkmrk--1"></a>Supported Platforms

<div class="contents" id="bkmrk-host-simulation-imx6"><div class="contents"><div class="textblock">- Host Simulation
- iMX6 Integrity
- Experimental support for other OpenGL ES 2.0 and OpenGL ES 3.0 based devices

</div></div></div>##### <a class="anchor" id="bkmrk--2"></a>Features

<div class="contents" id="bkmrk-capture-frame-timeli"><div class="contents"><div class="textblock">- Capture frame timeline (rendered cameras, nodes, OpenGL calls, …)
- Capture while application is running or in paused mode
- Single step to next frame
- Capture single node/single camera 
    - View color, depth and stencil buffer before &amp; after a node was rendered
    - Highlight pixels changed by the selected node
    - Save captured images as PNG
- Visualize intermediate results of rendered nodes.

</div></div></div><div class="contents" id="bkmrk-setup-usage"></div>

# Setup

#### <a class="anchor" id="bkmrk--1"></a>Build

To use the Frame Debugger, build the application with these CMake flags enabled:

<div class="contents" id="bkmrk-featstd_monitor_enab"><div class="contents"><div class="textblock"><table class="doxtable"><tbody><tr><td>**FEATSTD\_MONITOR\_ENABLED**</td><td>Enables basic Monitor features.</td></tr><tr><td>**MONITOR\_FRAME\_DEBUGGER\_ENABLED**</td><td>Enables basic frame debugger (frame timeline capture, single step mode, no OpenGL specific features).</td></tr><tr><td>**MONITOR\_FRAME\_DEBUGGER\_OPENGL\_CAPTURE\_ENABLED**</td><td>Enables OpenGL specific Frame Debugger features.</td></tr><tr><td>**COURIER\_RENDERING\_MONITOR\_ENABLED**</td><td>Additional flag required for [Courier](http://dev.doc.cgistudio.at/APILINK/namespace_courier.html) apps to enable monitor.</td></tr></tbody></table>

</div></div></div>Also make sure **MONITOR\_COM\_TYPE** is set to **FEATSTD\_COM\_TYPE\_TCPIP** and **MONITOR\_TCPIP\_ADDRESS** and **MONITOR\_TCPIP\_PORT** are set to appropriate values.

Additional CMake flags: The flag **MONITOR\_SINGLE\_STEP\_INTERVAL** can be used to set the time in milliseconds that is used when incrementing the animation time in single-step mode.

#### <a class="anchor" id="bkmrk--2"></a>Render loop

When using an application with a custom render loop (anything else than Player) add these macros to the beginning and end of the loop (defined in Candera/System/Monitor/MonitorPublicIF.h):

<div class="contents" id="bkmrk-monitor_marker_begin"><div class="contents"><div class="textblock">- MONITOR\_MARKER\_BEGIN\_FRAME();
- MONITOR\_MARKER\_END\_FRAME();

</div></div></div>#### <a class="anchor" id="bkmrk--3"></a>CGI Analyzer

To start the Frame Debugger, configure the connection settings in CGI Analyzer and then connect to the running application:

<div drawio-diagram="6861"><img src="https://doc316en.candera.eu/uploads/images/drawio/2024-09/drawing-5-1726846758.png" alt=""/></div>

<div class="contents" id="bkmrk--0"><div class="textblock"><div class="image">  
</div></div></div>

# Usage

#### <a class="anchor" id="bkmrk--3"></a>Main Toolbar

After the connection to the application has been established, the main Frame Debugger toolbar will become active.

<div class="contents" id="bkmrk-the-available-featur"><div class="contents"><div class="textblock"><dl class="note"><dt></dt><dd><p class="callout info">The available features here depend on the enabled features in the application during build time and on the platform on which the application is running.</p>

</dd></dl></div></div></div><div drawio-diagram="1299"><img src="https://doc316en.candera.eu/uploads/images/drawio/2023-02/drawing-4-1676527844.png" alt=""/></div>

<div class="contents" id="bkmrk-application-control-"><div class="contents"><div class="contents"><div class="textblock">- **Application**
    - Control application execution.
    - **Pause**: Pause application
    - **Continue**: Continue application execution
    - **Single Step**: Continue application for one frame
- **Frame Overview Capture**
    - Starts recording of all events of the next rendered frame in the application. The checkboxes indicate which events will be captured.
    - **Capture 2D/3D**: Indicates whether 2D/3D rendering events will be captured.
    - **Cameras**: Track which cameras are rendered.
    - **Nodes**: Track which nodes are rendered.
    - **OpenGL**: Track all OpenGL calls issued during the frame.
- **Capture Node**
    - This button is enabled after a frame overview capture has been completed and a valid node is selected in the resulting frame timeline. The checkboxes indicate which buffers will be captured.
    - The Node Capture will capture the state of the render target before and after the selected node has been rendered.
- **Capture Camera**
    - This button is enabled after a frame overview capture has been completed and a valid camera is selected in the resulting frame timeline. The checkboxes indicate which buffers will be captured.
    - The Camera Capture feature will capture the state of the render target before and after the selected camera has been rendered.

</div></div></div></div>#### <a class="anchor" id="bkmrk--5"></a>Frame Overview Capture

<div drawio-diagram="1300"><img src="https://doc316en.candera.eu/uploads/images/drawio/2023-02/drawing-4-1676527879.png" alt=""/></div>

<div class="contents" id="bkmrk--1"><div class="contents"><div class="textblock"><div class="image">  
</div></div></div></div>The frame timeline displays the cameras and nodes rendered during one frame in chronological order. Timestamps are measured relative to the beginning of the frame. The event list displays all recorded events as hierarchical list (Frame -&gt; Camera -&gt; Nodes -&gt; OpenGL calls).

The details panel displays multiple tabs with additional information, depending on the currently selected event in the event list. The “Capture” tab will always be displayed. It contains general information about the frame capture and additional display options. Further tabs like “Batch” are dynamic and depend on the selected node.

**"Stop rendering at selected node":** If this is selected and the target device is still connected, rendering on the target device will be stopped at the selected node. All nodes that appear after the selected one in the render order will be skipped.

<div class="contents" id="bkmrk-if-an-animation-is-r"><div class="contents"><div class="textblock"><dl class="note"><dt></dt><dd><p class="callout info">If an animation is running on the target device the render order might change dynamically and results will vary.</p>

</dd></dl></div></div></div>When a node is selected in the event list, the “Note Capture” feature will be available in the toolbar. When a camera is selected in the event list, the “Camera Capture” feature will be available in the toolbar.

<div class="contents" id="bkmrk-due-to-the-overhead-"><div class="contents"><div class="textblock"><dl class="note"><dd></dd><dd></dd><dd><p class="callout info">Due to the overhead associated with event recording the displayed timestamps might not accurately represent the render performance and should only be used for relative comparisons. For more accurate render performance measurements use the “Key Performance Indicators” feature of the CGI Analyzer.</p>

</dd></dl></div></div></div>#### <a class="anchor" id="bkmrk--7"></a>Node/Camera Capture

<div drawio-diagram="1301"><img src="https://doc316en.candera.eu/uploads/images/drawio/2023-02/drawing-4-1676527946.png" alt=""/></div>

<div class="contents" id="bkmrk-the-windows-displays"><div class="contents"><div class="textblock"><div class="image">The windows displays the result of a node/camera capture.  
</div></div></div></div><div class="contents" id="bkmrk-color-buffer%3A-displa"><div class="contents"><div class="contents"><div class="textblock">- **Color Buffer**:   
    Displays the captured color data. To the right of the image the data of the currently hovered pixel is displayed.
- **Depth Buffer/Stencil Buffer**:   
    Displays the captured depth/stencil data. The currently hovered pixel is displayed to the right. View Mode can be used to display the data in different ways: 
    - **Raw Data**: Show original data
    - **Scaled range**: Scale the values in the image to use the maximum available greyscale range.
    - **Colorized**: Computes false-color data to better visualize different data values.
- **Toolbar**: 
    - **Save**: Select a folder to save all captured images as PNG files.
    - **Refresh**: Capture the same node again.
- **Display Mode**:   
    Changes the data set that is shown in the “Color Buffer” and “Depth/Stencil Buffer” sections. 
    - **Post Node Render**: Framebuffer contents after the node was rendered.
    - **Pre Node Render**: Framebuffer contents before the node was rendered.
    - **Node Isolated**: Displays only pixel that were changed by the current node.
    - **Overdraw**: highlight (in pink) where the current node drew over already existing pixel data.

</div></div></div></div><p class="callout info">This is not a full overdraw visualization. It is computed based on the recorded data and will not produce exact results in all circumstances (e.g. transparent pixel, depth buffer inaccuracies, …)</p>

#### <a class="anchor" id="bkmrk--9"></a>Image Controls

The Color/Depth/Stencil buffer view support the following controls:

<div class="contents" id="bkmrk-mouse-scroll%3A-zoom-i"><div class="contents"><div class="textblock">- **Mouse Scroll**: Zoom In/Out
- **Mouse Click + Drag**: Move view
- **Right Click**: Reset view

</div></div></div>Additionally, the tabs “Color Buffer”, “Depth Buffer” and “Stencil Buffer” can be undocked (drag &amp; drop) to move them into separate windows and change their size.