# Memory Analyzer Overview

# Overview

Administrating memory is a very important part of developments for embedded devices. Therefore CGI Studio contains an own memory management to provide an abstraction layer and a higher controllability of memory behavior.   
The MemoryPool-Analyzer module extends the memory pool analyzing possibilities. It traces and displays the allocation behavior of an application. Furthermore it helps finding memory issues.

<div class="contents" id="bkmrk-knowledge-about-the-"><div class="contents"><div class="textblock"><dl class="note"><dt></dt><dd><p class="callout info">Knowledge about the functionality of MemoryPools memory management system may be of advantage</p>

</dd></dl></div></div></div>#### <a class="anchor" id="bkmrk-"></a>MemoryPool Analyzer feature list

The Analyzer traces and analyzes allocation behavior of the MemoryPool memory management. It supports: <span style="color: rgb(230, 126, 35);">[Obtaining data](https://doc316en.candera.eu/books/analyzer/page/obtaining-data "Obtaining data")</span> , <span style="color: rgb(230, 126, 35);">[Data presentation](https://doc316en.candera.eu/books/analyzer/page/data-presentation "Data presentation")</span> &amp; <span style="color: rgb(230, 126, 35);">[Analyzing the data](https://doc316en.candera.eu/books/analyzer/page/analyzing-the-data "Analyzing the data")</span>

# Overview of the graphical user interface

##### <a class="anchor" id="bkmrk--1"></a>This section contains:

The MemoryPool-Analyzer module extends the tab region of the Analyzer ribbon area.

<div drawio-diagram="1260"><img src="https://doc316en.candera.eu/uploads/images/drawio/2023-02/drawing-4-1676525983.png" alt=""/></div>

<div class="contents" id="bkmrk--0"><div class="contents"><div class="textblock">  
</div></div></div>The tab is split in three different groups:

<div class="contents" id="bkmrk-view%3A-filter-and-sel"><div class="textblock">- **View:** Filter and selection of a subset of traced data 
    - **Memory Pool Explorer:**   
        Shows the hierarchical memory structure. Content of review will be changed based on this selection. <dl class="see"><dt>**See also:**</dt><dd><span style="color: rgb(230, 126, 35);">[Memory Pool Explorer](https://doc316en.candera.eu/link/285#bkmrk-memory-pool-explorer)</span></dd></dl>
    - **Global Time Slider:**   
        This time slider provides access to memory snapshots. Most features are bound to this snapshot. <dl class="see"><dt>**See also:**</dt><dd><span style="color: rgb(230, 126, 35);">[Global Time Slider](https://doc316en.candera.eu/link/285#bkmrk-global-time-slider)</span></dd></dl>
    - **Memory Pool Properties:**   
        Provides general Properties of selected nodes (Memory Pool Explorer) at the specified memory snapshot. <dl class="see"><dt>**See also:**</dt><dd><span style="color: rgb(230, 126, 35);">[Memory Properties](https://doc316en.candera.eu/link/285#bkmrk-memory-properties%C2%A0)</span></dd></dl>
- **Reviews:** Access to statistics and analysis views 
    - **Memory Pool Charts:**   
        Shows memory trends over time and comparisons between different nodes. <dl class="see"><dt>**See also:**</dt><dd><span style="color: rgb(230, 126, 35);">[Memory Bar Charts](https://doc316en.candera.eu/link/285#bkmrk-memory-bar-charts)</span></dd><dd><span style="color: rgb(230, 126, 35);">[Memory Over Time Chart](https://doc316en.candera.eu/link/285#bkmrk-%C2%A0memory-over-time-ch)</span></dd></dl>
    - **Bad Smells:**   
        Provides different analysis tools to identify memory issues. <dl class="see"><dt>**See also:**</dt><dd><span style="color: rgb(230, 126, 35);">[Bad Smells](https://doc316en.candera.eu/link/286#bkmrk-bad-smells%C2%A0)</span></dd></dl>
    - **Memory Pool Statistics:**   
        Shows all traced information within a table. <dl class="see"><dt>**See also:**</dt><dd><span style="color: rgb(230, 126, 35);">[Memory Pool Statistics](https://doc316en.candera.eu/link/285#bkmrk-memory-pool-statisti)</span></dd></dl>
    - **Info List:**   
        Shows all logged messages. <dl class="see"><dt>**See also:**</dt><dd><span style="color: rgb(230, 126, 35);">[Information list](https://doc316en.candera.eu/link/285#bkmrk-information-list%C2%A0)</span></dd></dl>
- **MemoryPools:** Contains general content to improve the usability 
    - **Memory Settings:**   
        Provides several settings to configure the module. <dl class="see"><dt>**See also:**</dt><dd><span style="color: rgb(230, 126, 35);">[Settings](https://doc316en.candera.eu/link/286#bkmrk-settings%C2%A0)</span></dd></dl>
    - **File Editor:**   
        The Analyzer supports opening filepaths and present these files within the file editor. <dl class="see"><dt>**See also:**</dt><dd><span style="color: rgb(230, 126, 35);">[File Editor](https://doc316en.candera.eu/link/286#bkmrk-file-editor%C2%A0)</span></dd></dl>
    - **Refresh:**   
        Reloads dataset into views. If some errors in views occurred or dataset is not loaded properly, this button will reload these data and try to fix erroneous views.

</div></div>

# Obtaining data

#### **Traceable data: Which data will be traced?** 

##### <a class="anchor" id="bkmrk--2"></a>Allocating and releasing memory

The most important part of this Analyzer module is tracing all allocation and free calls within the code. That includes normal allocation/free calls as well as allocations in the Backing Heap.

The used terminology within the Analyzer is:

<div class="contents" id="bkmrk-allocate-memory-%3C-%3E-"><div class="contents"><div class="textblock">- Allocate memory &lt;-&gt; Alloc
- Free memory &lt;-&gt; Free
- Allocate in Backing Heap &lt;-&gt; Create
- Free Backing Heap Space &lt;-&gt; Destroy

</div></div></div>##### <a class="anchor" id="bkmrk--3"></a>Informational data

<div class="contents" id="bkmrk-this-feature-is-not-"><div class="contents"><div class="textblock"><dl class="note"><dt></dt><dd><p class="callout info">This feature is not added to a public interface yet.</p>

</dd></dl></div></div></div>Additional to these four existing types are several information types.  
These informations are used to provide more information and are generally used as orientation and filter helpers.

List of information types:

<div class="contents" id="bkmrk-allocation-failed-me"><div class="contents"><div class="textblock">- Allocation failed message: Contains information of the failed request
- Warning message
- Error message - Possible types: textual message or error code
- Info message: Supports different priority levels additional to the message
- Start and end marker: Defines a named time range

</div></div></div>##### <a class="anchor" id="bkmrk--4"></a>Start and end marker

These marker define a specified timespan within application runtime.   
Example: Encapsulate the render loop. Based on these markers it is easy to find out which memory changes happened every single loop iteration.

#### **Retrieving data** 

##### <a class="anchor" id="bkmrk--5"></a>Binary memory logging

The standard way to log memory changes is to enable it with CMake.  
To enabled it you have to complete the following steps:

<div class="contents" id="bkmrk-enable-memorypools-f"><div class="contents"><div class="textblock">- Enable MemoryPools ```
    <a class="code" href="http://dev.doc.cgistudio.at/APILINK/group___f_e_a_t_s_t_d___c_o_n_f_i_g.html#ga6e3f7a95a0d06b38bb0c255dd80ecb3a">FEATSTD_MEMORYPOOL_ENABLED</a> true
    ```
- Enable monitoring ```
    <a class="code" href="http://dev.doc.cgistudio.at/APILINK/group___f_e_a_t_s_t_d___c_o_n_f_i_g.html#gaa5831e2f6fa8672573f44659e5208a0d">FEATSTD_MONITOR_ENABLED</a> true
    ```
- Enable memory binary logging ```
    MONITOR_MEMORYPOOL_BINARY_LOGGING_ENABLED true
    ```

</div></div></div>Optional:

<div class="contents" id="bkmrk-change-filename-moni"><div class="contents"><div class="textblock">- Change filename ```
    MONITOR_MEMORYPOOL_BINARY_LOGGING_FILENAME "filename.membin"
    ```

</div></div></div><div class="contents" id="bkmrk-only-logging-into-a-"><div class="contents"><div class="textblock"><dl class="note"><dd><p class="callout info">Only logging into a file is currently supported. Turning off Performance Recording whilst logging memory changes is currently not supported yet. Using TCP/IP or Serial without an established connection (and therefore Performance Recording is ignored) is working though.</p>

</dd></dl></div></div></div>##### <a class="anchor" id="bkmrk--6"></a>Textual memory logging

It is possible to load a trace-log of your Logger into the Analyzer. There are a few required steps to make it work.

<div class="contents" id="bkmrk-the-logger-has-to-be"><div class="textblock">- The logger has to be enabled
- The messages are sent as DEBUG messages. So the logging level has to be DEBUG as minimum. ```
     <a class="code" href="http://dev.doc.cgistudio.at/APILINK/group___f_e_a_t_s_t_d___d_i_a_g_n_o_s_t_i_c_s.html#gaed9977d4815267bd05e7dcee49f94f4b">FEATSTD_LOG_SET_LOG_LEVEL</a>(<a class="code" href="http://dev.doc.cgistudio.at/APILINK/group___f_e_a_t_s_t_d___d_i_a_g_n_o_s_t_i_c_s.html#ggad2cbc908487f2a3b4340020c0f69bda0af5dfc3720ca935220d7c86cf1bb2aa27" title="Debug.">Debug</a>);
    ```
    
    <dl class="note"><dd><p class="callout info">Set the log level as soon as possible. All allocations before will not be traced, this also includes the memory pool preinitialization.</p>
    
    </dd></dl>
- The messages have to keep their default format: ```
    // sample for heap alloc
    0000000.025 [0x00000000] DEBUG FeatStdMemoryManagement FeatStdDefaultMemoryPool(0) heap alloc 0E2A93D0(24:P)
    // sample for alloc memory
    0000000.026 [0x00000000] DEBUG FeatStdMemoryManagement \featstd\src\FeatStd/Container/Vector.h(696): FeatStdDefaultMemoryPool(0) alloc 0E2A93E0 8(24:P)
    // sample for free memory
    0000000.027 [0x00000000] DEBUG FeatStdMemoryManagement \featstd\src\FeatStd/Container/Vector.h(696): FeatStdDefaultMemoryPool(0) free 0E2A93E0 8(24:P)
    // sample for heap free
    0000000.028 [0x00000000] DEBUG FeatStdMemoryManagement FeatStdDefaultMemoryPool(0) heap free 0E2A93D0(24:P)
    ```
    
    <dl class="note"><dd><p class="callout info">CgiAppLogger replaces the default logger and changes the format for DEBUG messages.</p>
    
    </dd></dl>
- To trace all possible data, it is important to create the LogAppender before initializing memory pools and destroy it afterwards.
- The file extension for these files has to be '\*.memlog'

</div></div><div class="contents" id="bkmrk-all-the-other-messag"><div class="textblock"><dl class="note"><dd><p class="callout info">All the other message types: <span style="color: rgb(230, 126, 35);">[info, warning, error, start/end marker](#bkmrk-traceable-data%3A-whic-0)</span> are not available when using these textual logs.</p>

</dd></dl></div></div>#### **Loading data** 

All logfiles can be loaded by clicking the application menu button -&gt; open -&gt; Open Memory-Log or by Drag'n'Drop.  
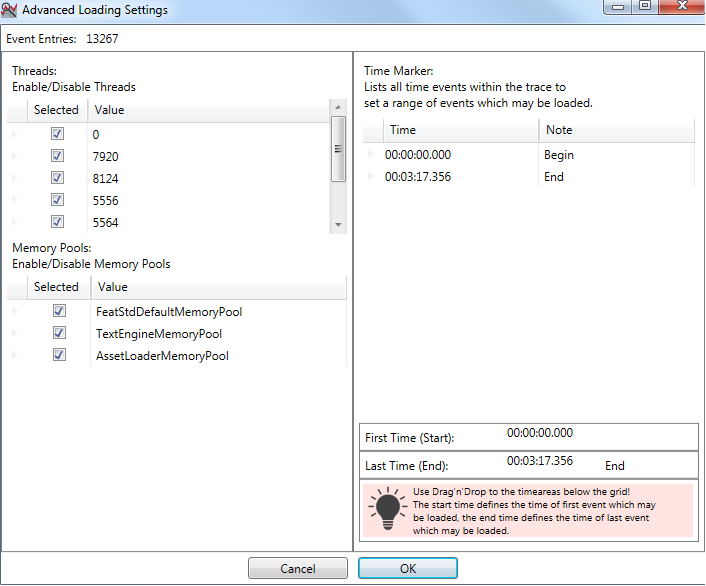
When loading a binary log file, a loading window will open after preanalyzing the content of the log file.

<div drawio-diagram="2983"><img src="https://doc316en.candera.eu/uploads/images/drawio/2023-03/drawing-4-1677747175.png" alt=""/></div>

<div class="contents" id="bkmrk--0"><div class="contents"><div class="textblock">  
</div></div></div>This window gives information about the logfile and allows to prefilter the dataset.  
It is possible to:

<div class="contents" id="bkmrk-disable-threads-disa"><div class="textblock">- Disable threads
- Disable memory pools
- Set a time range based on all recorded time marker. Use Drag'n'Drop to place a time marker on 'Start' or 'End'.

</div></div><div class="contents" id="bkmrk-large-log-files-may-"><div class="textblock"><dl class="note"><dt><p class="callout info">Large log files may slow down the analyzer drastically. The MemoryPool-Analyzer settings contains a property to set a cap for maximum loaded entries</p>

</dt></dl></div></div><div class="contents" id="bkmrk--8"></div>

# Data presentation

#### **Term definitions** 

<div class="contents" id="bkmrk-node%3A-a-node-is-defi"><div class="textblock">- Node: A node is defined as an instance of MemoryPool such as a block, a bin, a MemoryPool and the program itself.
- Event: An event represents a happening which were recorded. Events can be all types of allocations and frees.
- System: One complete log including all events and nodes.
- Requested Size: Requested size defines the size a user tried to allocate.
- Used Size: Used size defines the size which was actually allocated by the MemoryPools.
- Total Size: Total size is the current size of a node within the backing heap.
- Delta: It is possible that memory changes can happen in a not measurable time depending on the time resolution. A delta is an additional indicator to order calls within the same timestamp.

</div></div><div class="contents" id="bkmrk-all-sizes-do-not-con"><div class="textblock"><dl class="note"><dd><p class="callout info">All sizes do NOT contain the overhead of header information. The sizes always refer to the actual buffer size which can be used by the application.</p>

</dd></dl></div></div>#### **How to select data** 

##### <a class="anchor" id="bkmrk--14"></a>Memory Pool Explorer

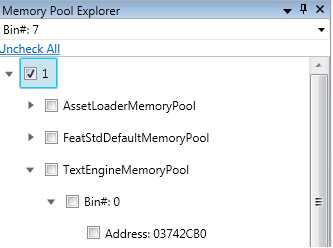
The Memory Pool Explorer is used to restrict certain views to a specific dataset. It filters nodewise.  
In many usecases the knowledge about a specific node is important.  
For example:

<div class="contents" id="bkmrk-how-much-memory-were"><div class="contents"><div class="textblock">- How much memory were allocated in total?
- How much memory were allocated per MemoryPool?
- What is the proportion between these two?
- What is the difference between two systems?
- ... The Memory Pool Explorer is the primary way to indicate which nodes have to be compared.

</div></div></div>The hierarchy of the explorer is:

<div class="contents" id="bkmrk-systems-memorypools-"><div class="contents"><div class="textblock">- Systems 
    - MemoryPools 
        - Bins 
            - Blocks

</div></div></div>In most cases Systems and MemoryPools are enough to give a rough understanding how two nodes do relate.  
However, sometimes it is also important to understand how specific bins or even blocks (addresses) are used.  
Therefore all available nodes can be selected individually.   
Searching for a specific address can be quite troublesome, so a search bar for nodes exists to make the finding process easier.

<div drawio-diagram="1273"><img src="https://doc316en.candera.eu/uploads/images/drawio/2023-02/drawing-4-1676526654.png" alt=""/></div>

<div class="contents" id="bkmrk--0"><div class="contents"><div class="textblock">  
</div></div></div>##### <a class="anchor" id="bkmrk--16"></a>Global Time Slider

The Global Time Slider provides a slider with integrated zoom bar. The slider defines the current system time of which you may want to get further information.  
To go to the first occurring time or the very last entry within the trace, you may click on one of the two buttons at left and right side of slider.

At some time it is important to have a memory snapshot at a given time. The slider is used to select the required time.

<div drawio-diagram="1274"><img src="https://doc316en.candera.eu/uploads/images/drawio/2023-02/drawing-4-1676526683.png" alt=""/></div>

#### **Memory Properties** 

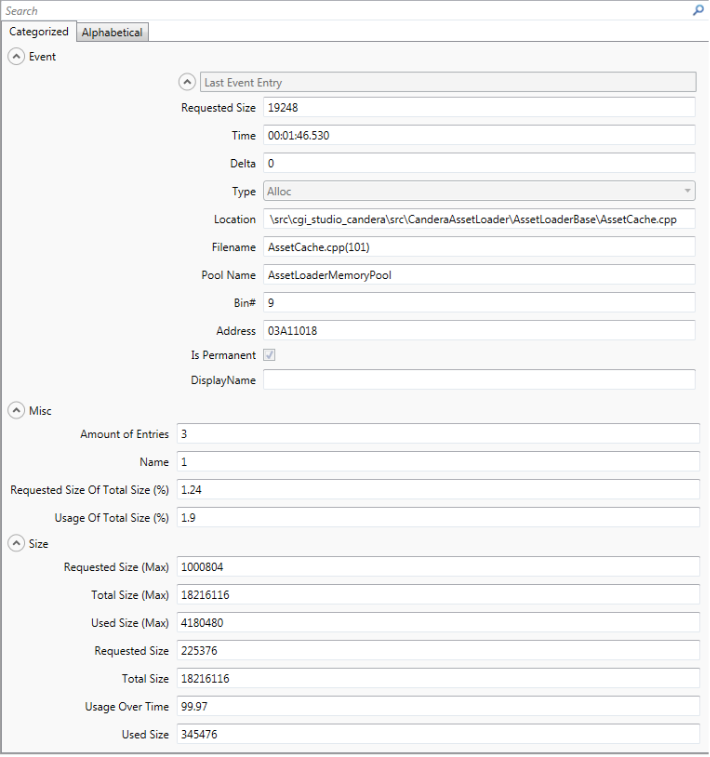
The memory pool properties view gives a short overview of currently selected nodes.  
The reference time for any information provided by the property list is based on the global time slider and its time value.

The properties are divided into three categories:

<div class="contents" id="bkmrk-event%3A-shows-the-ver"><div class="contents"><div class="textblock">- Event: Shows the very last event happened to the selected node(s) and its detailed information.
- Misc: Gives a brief overview of current selected nodes and statistics.
- Size: Shows information about the three size values: requested size, used size and total size. Additionally, information about the maximum up until the set global time of each size is given.

</div></div></div><div drawio-diagram="1275"><img src="https://doc316en.candera.eu/uploads/images/drawio/2023-02/drawing-4-1676526721.png" alt=""/></div>

<div class="contents" id="bkmrk--4"></div>#### **Memory Pool Statistics** 

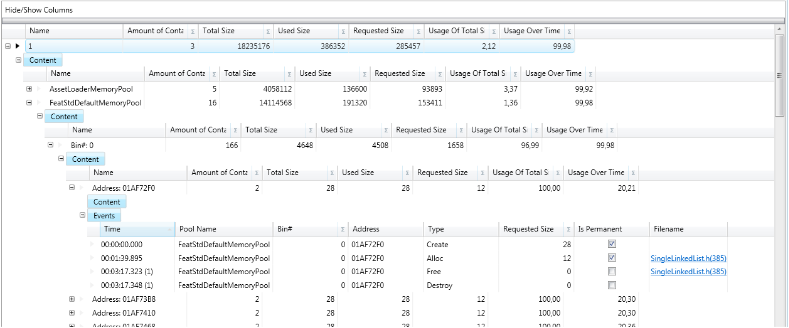
The memory pool statistics gives a detailed information about all events occurred on the selected nodes and sub nodes. Additionally the current size related values are shown.

Each node contains two different types of table: A content table and an event table.

The content table gives information about:

<div class="contents" id="bkmrk-name-of-node-amount-"><div class="contents"><div class="textblock">- Name of node
- Amount of container: How many nodes does this container have?
- Total size
- Used size
- requested size
- usage of total size: How much size is in use compared to total size in percentage
- usage over time: how long is a node or one of his sub nodes in use compared to total length of time.
- Maximum of requested size until global time selected by slider.
- Maximum of used size until global time selected by slider.
- Maximum of total size until global time selected by slider.

</div></div></div>The event table gives information about:

<div class="contents" id="bkmrk-the-time-when-an-eve"><div class="contents"><div class="textblock">- The time when an event occurs
- The delta time of event. Sometimes more than one event occurs at the same time. To create a chronological order a second time is base is created. The second time base is called delta.
- Pool name in which the event occurs.
- Bin number in which the event occurs.
- Address of block which raises the event.
- Type of event.
- Requested size: A creation sets the block size which was created; an allocation sets size of user request. Otherwise its 0.
- Permanent: Permanent flag of creation or allocation. Destructions and frees do not have this flag, so it’s always not set.
- Filename: Shows location where event occurred. Creations and destructions do not have a location. Clicking on a filename opens the specific file in a file editor.

</div></div></div><div drawio-diagram="1276"><img src="https://doc316en.candera.eu/uploads/images/drawio/2023-02/drawing-4-1676526754.png" alt=""/></div>

<div class="contents" id="bkmrk--6"></div>#### **Memory Bar Charts**

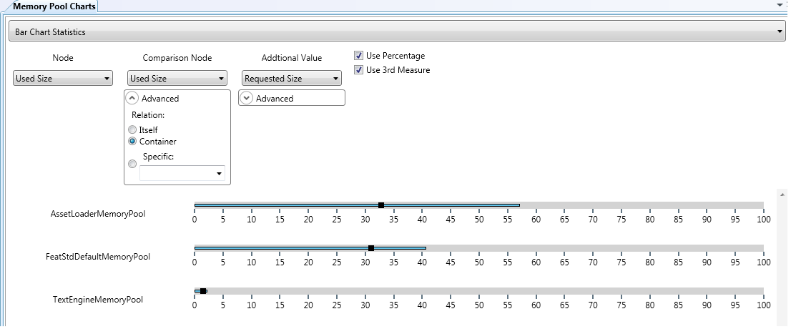
Accessing the Memory Bar Charts is done by clicking on Memory Pool Charts on the Analyzer ribbon tab and selecting 'Bar Chart Statistics' on the drop down menu.

The Memory Bar Charts are used to directly compare different nodes at a specified time.

There are a total of three different values which can be shown within a single bar chart simultaneously. Any value can be set independent from the others.  
The first value always refers to a selected node. The others can show information of the selected node, Information of the node which contains the selected node or a specific reference to a node. When last option is chosen every selected node has the specified node as second reference.

Current comparison values are:

<div class="contents" id="bkmrk-used-size-requested-"><div class="contents"><div class="textblock">- Used Size
- Requested size
- Total Size
- Usage over time
- Maximum of requested size
- Maximum of used size
- Maximum of total size

</div></div></div>The third comparison value is activated when the checkbox is checked.  
Another option is to toggle the percentage mode. When this mode is active, relationship between node's value and its comparison value is shown in percentage.

<div drawio-diagram="1277"><img src="https://doc316en.candera.eu/uploads/images/drawio/2023-02/drawing-4-1676526788.png" alt=""/></div>

<div class="contents" id="bkmrk--9"></div>####   
**Memory Over Time Chart** 

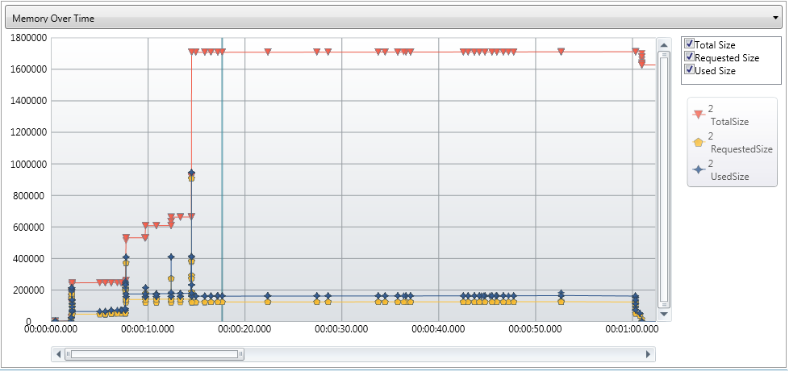
Accessing the Memory Over Time Charts is done by clicking on Memory Pool Charts on the Analyzer ribbon tab and selecting 'Bar Chart Statistics' on the drop down menu.

This chart gives a visual overview of the memory behavior over time. All selected nodes are shown within this chart. Every selected node provides three different lines within this chart:

<div class="contents" id="bkmrk-requested-size-used-"><div class="contents"><div class="textblock">- Requested size
- Used size
- Total size

</div></div></div>All three of them can be disabled to concentrate on the currently most important graph. Within this chart is a vertical line which marks the time value selected by the slider.

<div drawio-diagram="1278"><img src="https://doc316en.candera.eu/uploads/images/drawio/2023-02/drawing-4-1676526816.png" alt=""/></div>

<div class="contents" id="bkmrk--11"></div>#### **Information list**   


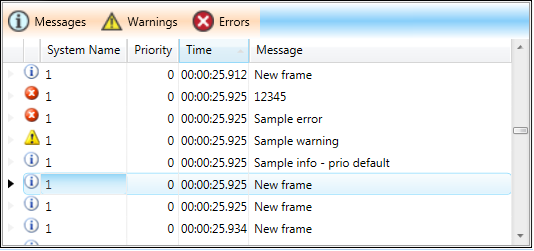
The info list lists all occurred notification events. A notification event can be an info message, warning or error.

There are three types of info messages:

<div class="contents" id="bkmrk-start-key-message%3A-s"><div class="contents"><div class="textblock">- Start key message: Sets a start point
- End key message: Sets an endpoint
- Information message

</div></div></div>A start key and its corresponding end key, both have to have the same name, are forming a group. An information message may have a priority level. The default priority is set to 0. All three types can be toggled on or off.

<div class="contents" id="bkmrk-see-also%3A-informatio"><div class="contents"><div class="textblock"><dl class="see"><dt>**See also:**</dt><dd><span style="color: rgb(230, 126, 35);">[Informational data](https://doc316en.candera.eu/link/282#bkmrk-informational-data)</span></dd></dl></div></div></div><div drawio-diagram="1279"><img src="https://doc316en.candera.eu/uploads/images/drawio/2023-02/drawing-4-1676526852.png" alt=""/></div>

# Analyzing the data

#### **Bad Smells** 

##### <a class="anchor" id="bkmrk--2"></a>Overview

The depth-first search analyze tools or 'Bad Smells' are tools to find abnormalities and lists several information about the currently loaded log trace.  
Most information is connected to event occurrence location. The word location in the following context references to this kind of location.  
Every tool can be started separately when clicking on rerun.   
An entry within the found entry list can be marked as false positive either by drag and drop to defined false positive area or by context menu.

##### <a class="anchor" id="bkmrk--3"></a>Path Allocation Count

The path allocation count lists all existing locations and its amount of allocations that happens at this location.  
Based on the total amount of allocation a percentage value is created.  
The summary gives information about how many locations hold more than the specified percentage threshold.  
To change this threshold go to Memory Settings and choose the tab of path allocation count.

##### <a class="anchor" id="bkmrk--4"></a>Reoccurring cluster

This tool searches for reoccurrences within the log trace. A cluster is defined as a location which is followed by one or more locations. The reoccurrence is defined by settings. When a location and its follow-ups are reoccurring over and over again, it is marked as a found entry.  
The settings provide several limitations.  
The maximum length of a cluster can be set to reduce calculation time.  
The minimum occurrences thresholds filter more data to concentrate on most reoccurring clusters.  
When a location is rarely in use, this location may always be marked as end of a cluster. This value of usage can also be specified.

##### <a class="anchor" id="bkmrk--5"></a>Memory hold per line

This tool gives an overview of the total allocation size of each location and a brief overview of which allocations were requested.  
It lists all information without thresholds because any information can be useful.

##### <a class="anchor" id="bkmrk--6"></a>Short allocation duration

This tool shows all allocations which may be freed shortly after this allocation. The time difference can be set within the settings.  
An additional summary shows all locations which hold more than a specified threshold of appearances in percentage. It also includes the amount of appearances.

##### <a class="anchor" id="bkmrk--7"></a>Memory leak detector

This tool searches for possible memory leaks. The accuracy is based on the input data. If entries are missing or the trace ends before entire shutdown, some allocations may have no corresponding free event. Filtering the dataset also affects the output. Filtering the data can be disabled in settings.

##### <a class="anchor" id="bkmrk--8"></a>Never used blocks

This tool searches for blocks which are created within the backing heap but are never used. This mainly happens when memory is preallocated but never used.

##### <a class="anchor" id="bkmrk--9"></a>Block creation after init

This tool searches for blocks which are created after the preallocation or initialization.

##### <a class="anchor" id="bkmrk--10"></a>Current Block Configuration

This tool gives a brief overview of blocks which were allocated in the backing heap. There are two different values. The first one defines the maximum block amount of a specific block size. And the second one specifies the amount of blocks which are used at the time of global time slider.

#### **File Editor** 

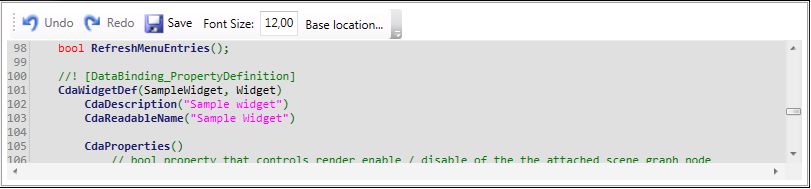
The file editor may be opened by clicking the menu button or when a highlighted filename or path is clicked.  
The editor provides basic syntax highlighting. Files can be altered and saved.

<div class="contents" id="bkmrk-when-altering-file%2C-"><div class="contents"><div class="textblock"><dl class="note"><dd><p class="callout info">When altering file, no syntax error check may be done.</p>

</dd><dd></dd></dl></div></div></div><div drawio-diagram="1287"><img src="https://doc316en.candera.eu/uploads/images/drawio/2023-02/drawing-4-1676527254.png" alt=""/></div>

<div class="textblock" id="bkmrk--0"></div><div class="textblock" id="bkmrk--1"></div>####   
**Settings** 

The memory settings contain all threshold and settings which can be set. There are currently three different types of settings:

<div class="contents" id="bkmrk-memory-settings-dept"><div class="contents"><div class="textblock">- Memory settings
- Depth-first search analyzing settings
- Filter settings

</div></div></div>Every settings type has two default settings:

<div class="contents" id="bkmrk-use-filtered-entries"><div class="contents"><div class="textblock">- Use filtered entries: When this flag is set currently selected filters are in use - shown dataset is removed to its selection.
- Enabled: Enables or disables the current settings. Depth-first search will not be done at load time when its enabled flag is not set but the bad smell startup is set.

</div></div></div>The memory settings change overall settings of memory to improve usability and performance:

<div class="contents" id="bkmrk-filter-data-while-lo"><div class="contents"><div class="textblock">- Filter data while loading: previously set filter are filtering data when trace is loaded. This reduces the amount of data which may be loaded and increases performance.  
    It also excludes unwanted information.
- Maximum loadable event entries: This value prevents the system to become irresponsible when too many entries are added. The value which should be set depends on the target system on which the program is running.
- Bad smell startup enable: Enables the calculation run of all depth-first searches after a dataset is loaded. This slow down the loading progress but you do not have to press the calculation button for every single tool and continually wait until the next tool is done with calculation.
- Line chart - Edges: When an event occurs like an allocation, the used memory does not increase like a continual signal. The increase may happen in an instance like a discrete signal. Therefore the usage over time chart is discrete. Each edge needs a second entry to be set. That results in a double amount of marker within the chart. Too many markers may slow down the system.
- Line chart - marker: Every Marker provides additional information about the current event happening at a specific position. If this information is not needed and the performance decreases drastically, it is recommended to disable the markers. Disabling the markers also change the visual impression of the chart. The detailed information is removed and the overview over the usage of time is increased.
- Line chart - resolution: The resolution affects the drawing of line within the chart. A higher value may ignore datasets when drawing the connecting line and increases performance.

</div></div></div>##### <a class="anchor" id="bkmrk--12"></a>Filter

Every filter type has specific flags which can be set like the enabled flag.  
Additionally, every filter type contains a list of all existing filter of its type.   
The time range filter is able to reduce the dataset to the selected time area.   
The time ranges are based on keynotes. Additional time ranges can be created by user, too.  
The thread filter filters all data of specific threads, processes or systems. If the thread name stays the same in two different traces, the system name and/or process name can be ignored. Only the thread names will be checked when filtering.

<div class="contents" id="bkmrk-normally%2C-pid-and-th"><div class="textblock"><dl class="note"><dd><p class="callout info">Normally, PID and thread IDs are given randomly by system. There is no guaranteed way to filter specific threads/processes away when loading new traces.</p>

</dd></dl></div></div>