# GUI Shell Overview
# Menu
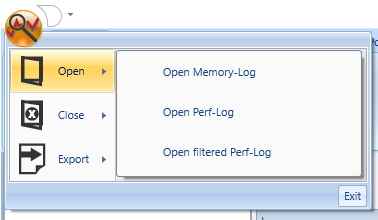
The menu contains three main items:
1. Open - provides opening different file types of all loaded modules. Drag and drop of files is also working as an alternative.
2. Close - closes an opened file.
3. Export - exports module specific data if supported.
# Tabs
The default Tabs are General and Online. Additional tabs are added when a new module is loaded. General contains buttons to open the default settings interface, a log window and buttons for common help functions. Online contains the necessary buttons to establish a connection. E.g. configuration, start and stop of a connection. The online tab also contains all module specific interaction between analyzer and target/simulation.
# Settings Window
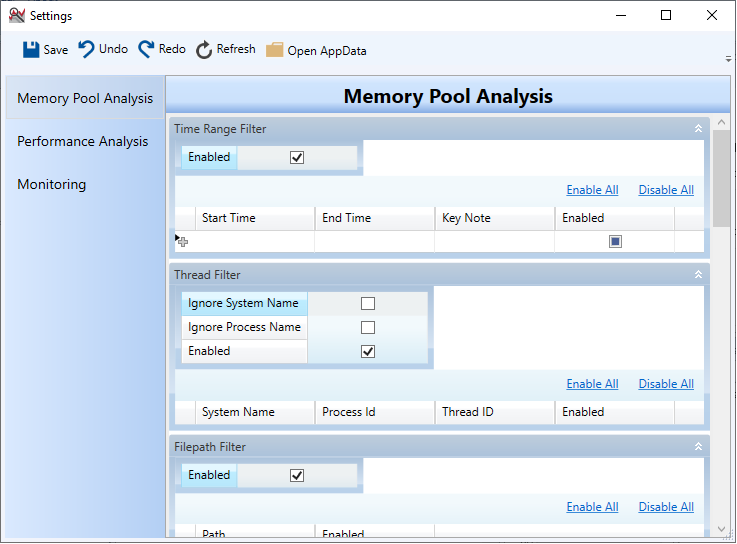
The settings in general contains monitoring settings. Further details can be found in supported communication types section. All possible settings are found in this window. These settings are stored at "%AppData%\\CGIAnalyzer" in your windows filesystem. This location can be easily opened with clicking 'Open AppData'-Button. Settings are saved when pressing the 'Save'-Button or closing the settings interface.
# Log Window
The log window prints all kind of information messages. E.g. connection informations, loading errors and module specific messages.